Average Ratings 0 Ratings
Average Ratings 27 Ratings
Similar Products
-
AdRem NetCrunchNetCrunch is commercial, self-hosted, agentless network and IT infrastructure monitoring software for Windows Server. It monitors network devices, servers, virtualization platforms, cloud services, applications, websites, logs, telemetry, and network traffic across distributed environments. NetCrunch supports 680+ monitoring targets and provides 270+ ready-to-use Monitoring Packs for devices, applications, and operating systems. Policy-based monitoring automatically applies monitoring settings, Monitoring Packs, thresholds, and alerts to matching devices and systems. Licensing is based on monitored nodes and network interfaces rather than individual sensors, checks, or metrics. NetCrunch provides real-time dashboards and automatic Layer 2 and routing topology maps for visibility into network status and performance. Network traffic analysis supports NetFlow, sFlow, IPFIX, and other flow technologies. Its alerting system supports event correlation, dependency-aware suppression, predictive thresholds, escalation, and 40+ automated response actions, including scripts, notifications, API calls, and integrations with external systems. Distributed Monitoring Probes extend monitoring to remote and isolated locations. NetCrunch also provides a REST API for integration and automation with external IT management, service management, and operational systems. NetCrunch is self-hosted on Windows Server and can monitor on-premises, air-gapped, cloud, and hybrid IT environments.
-
OvermonitorOvermonitor is cloud-based infrastructure, website, and endpoint monitoring built for teams that want fast setup, clear alerts, and practical visibility without the complexity or cost of enterprise monitoring suites. Monitor websites, servers, endpoints, processes, Windows services, event logs, uptime, response time, SSL certificates, and internal network health from one easy dashboard. At the core of Overmonitor is a small, lightweight server agent that installs quickly, pairs with your account, and reports a heartbeat every minute from inside your network. This gives you visibility beyond public uptime checks, helping detect server outages, stalled services, failing processes, internal connectivity problems, and endpoint health issues before they become customer-facing downtime. Overmonitor supports city-level geotargeted monitoring, practical maintenance windows that reduce alert noise, push notifications for alerts, audible dashboard alerts for operations screens, process monitor rollups, embeddable performance graphs, and flexible à la carte pricing so you only pay for the monitoring you need. Designed for SaaS operators, IT teams, MSPs, developers, and small businesses, Overmonitor helps you track availability, analyze website performance, monitor infrastructure health, and improve end-user experience without being locked into a bloated monitoring platform.
-
Grafana CloudGrafana Labs delivers the leading AI-powered observability platform, built around Grafana—the most widely adopted open source technology for dashboards and visualization. Recognized as a Leader in the 2025 Gartner® Magic Quadrant™ for Observability Platforms, Grafana Labs supports more than 25 million users and thousands of organizations worldwide, from startups to Fortune 500 enterprises. Grafana Cloud is the open observability cloud, designed to help engineering teams observe everything and solve anything. Built on open source, open standards, and open ecosystems, it unifies metrics, logs, traces, and profiles in a single platform for full-stack visibility across applications, infrastructure, and digital experiences. At the core is the open-source LGTM stack: Grafana for dashboards and visualization, Mimir for metrics, Loki for logs, and Tempo for distributed tracing. Native OpenTelemetry and Prometheus support allow teams to ingest telemetry from virtually any environment, while hundreds of integrations connect existing tools and data sources without costly rip-and-replace migrations. Grafana Cloud combines powerful analytics with AI-driven observability. Grafana Assistant helps engineers investigate issues, explore telemetry, and troubleshoot faster. Adaptive Telemetry identifies the data that matters most and aggregates the rest, helping organizations reduce telemetry costs while preserving valuable insights . With solutions for Kubernetes monitoring, application observability, digital experience monitoring, incident response, synthetic monitoring, and performance testing, Grafana Cloud delivers a complete observability platform that scales with your business.
-
Uptime.comUptime.com website monitoring solutions provide unmatched visibility and availability, empowering engineering, operations and SRE teams to monitor & respond to their most essential services. Simple & intuitive industry leading Enterprise-grade features delivered at a fair price, that are continuously improving. G2, Sourceforge and TechRadar Pro have recognized us as one of the world’s best uptime monitors for several consecutive years, including this one. Try 100% free.
-
AuvikAuvik Network Management is a network management and monitoring software designed to empower IT professionals with deep visibility, automation, and control over their network infrastructure. This innovative platform is trusted by businesses of all sizes to streamline network operations, enhance security, and optimize performance. One of Auvik's standout features is its real-time network mapping and discovery capabilities. It automatically generates interactive, visual maps of your network topology, allowing you to easily identify devices, connections, and potential bottlenecks. This invaluable insight helps in planning and optimizing network architecture for maximum efficiency.
-
PathSolutions TotalViewTotalView offers network monitoring as well as root-cause troubleshooting of problems in plain-English. The solution monitors every device as well as every interface on every device. In addition, TotalView goes deep, collecting 19 error counters, performance, configuration, and connectedness so nothing is outside of it’s view. A built-in heuristics engine analyzes this information to produce plain-English answers to problems. Complex problems can now be solved by junior level engineers leaving the senior level engineers to work on more strategic level projects. The core product includes everything needed to run a perfectly healthy network: Configuration management, server monitoring, cloud service monitoring, IPAM, NetFlow, path mapping, and diagramming. Get Total Network Visibility on your network and solve more problems faster.
-
kama.aikama.ai is a Responsible AI Agent platform that gives you an accurate, accountable, and safe AI for your organization. It is used for training, quick source of truth for compliance issues, internal support, customer service, and for specialized communities needs. Unlike generic GenAI tools that create answers probabilistically, kama.ai combines deterministic Knowledge Graph AI with governed Generative AI and Trusted Collections. Trusted Collections is a RAG technology that minimizes generative side hallucinations, while providing a core source for accurate, brand-safe, and a correct information source for AI answers. It lets organizations control what their AI Agents know, where answers come from, and how information is delivered to employees, customers, learners, members, or community users. kama.ai’s platform is designed for situations where answers must be accurate, traceable, brand-safe, and aligned with approved source material. Human experts and Knowledge Managers can curate content, review AI-generated drafts, manage knowledge domains, and improve responses over time. This supports a governed-in-advance approach to AI, rather than relying on after-the-fact correction. kama.ai is especially well suited for knowledge-heavy organizations, training programs, compliance environments, Indigenous and community-focused initiatives, HR support, education, research, and other use cases where trusted information matters. This platform focused on Responsible AI use and delivery, results in safer AI adoption, better knowledge access, reduced repetitive workload, and more consistent support for the people who rely on your organization’s expertise. Think kama.ai for trusted AI, governed knowledge, and answers your organization is willing to stand behind.
-
ManageEngine Log360Log360 is a SIEM or security analytics solution that helps you combat threats on premises, in the cloud, or in a hybrid environment. It also helps organizations adhere to compliance mandates such as PCI DSS, HIPAA, GDPR and more. You can customize the solution to cater to your unique use cases and protect your sensitive data. With Log360, you can monitor and audit activities that occur in your Active Directory, network devices, employee workstations, file servers, databases, Microsoft 365 environment, cloud services and more. Log360 correlates log data from different devices to detect complex attack patterns and advanced persistent threats. The solution also comes with a machine learning based behavioral analytics that detects user and entity behavior anomalies, and couples them with a risk score. The security analytics are presented in the form of more than 1000 pre-defined, actionable reports. Log forensics can be performed to get to the root cause of a security challenge. The built-in incident management system allows you to automate the remediation response with intelligent workflows and integrations with popular ticketing tools.
-
New RelicAround 25 million engineers work across dozens of distinct functions. Engineers are using New Relic as every company is becoming a software company to gather real-time insight and trending data on the performance of their software. This allows them to be more resilient and provide exceptional customer experiences. New Relic is the only platform that offers an all-in one solution. New Relic offers customers a secure cloud for all metrics and events, powerful full-stack analytics tools, and simple, transparent pricing based on usage. New Relic also has curated the largest open source ecosystem in the industry, making it simple for engineers to get started using observability.
-
ProcareProcare is the most widely used child care management solution for child care centers, before and after school programs, and youth organizations to ease the burdens of running a business, coordinating staff, communicating with parents, and educating their children. ADMINISTRATION Manage every aspect of your center or multi-centers, all in one cloud-based, integrated platform. COMMUNICATION Keep your staff and parents connected on all milestones and activities, whether by phone, email, text, or the app, creating an environment of exceptional child care. BILLING AND PAYMENTS Automated billing and payment collection, making it convenient for parents while providing integrated, real-time data and functionality for providers. FINANCIAL MANAGEMENT Central real-time view of all financials and receivables for the center through the integrated dashboard. LESSON PLANNING Create lesson plans, student assessments, and manage lessons by classroom without the stress and time-consuming task of outdated paper formats. MOBILE APP An easy-to-use app that is fully integrated, for staff and family engagement, allowing centers to stay connected with families. AND MORE.. That’s why over 40,000 customers choose Procare.
Description
Time and time again, we found ourselves assisting with software projects that struggled to provide a clear answer to the question, “Is the application functioning correctly at this moment?” This issue wasn’t due to a lack of monitoring tools or a deficiency in skilled team members; they consistently had both. The real problem lay in the fact that the existing tools failed to address the critical inquiries regarding the software’s technical health. While “turn-key” monitoring solutions may appear appealing and easy to deploy, they ultimately become a financial drain if they don’t provide meaningful insights. In contrast, Instrumental offers application and server monitoring that seamlessly aligns with your needs. Monitoring all aspects that are unique, intriguing, and crucial about your software has never been easier. With its robust query language designed for insightful questioning, stunning visualizations, top-notch sharing capabilities, and affordability for both small startups and major corporations alike, Instrumental stands out as a valuable asset in the realm of software monitoring. This makes it an essential tool for any organization aiming to enhance their technical health assessment.
Description
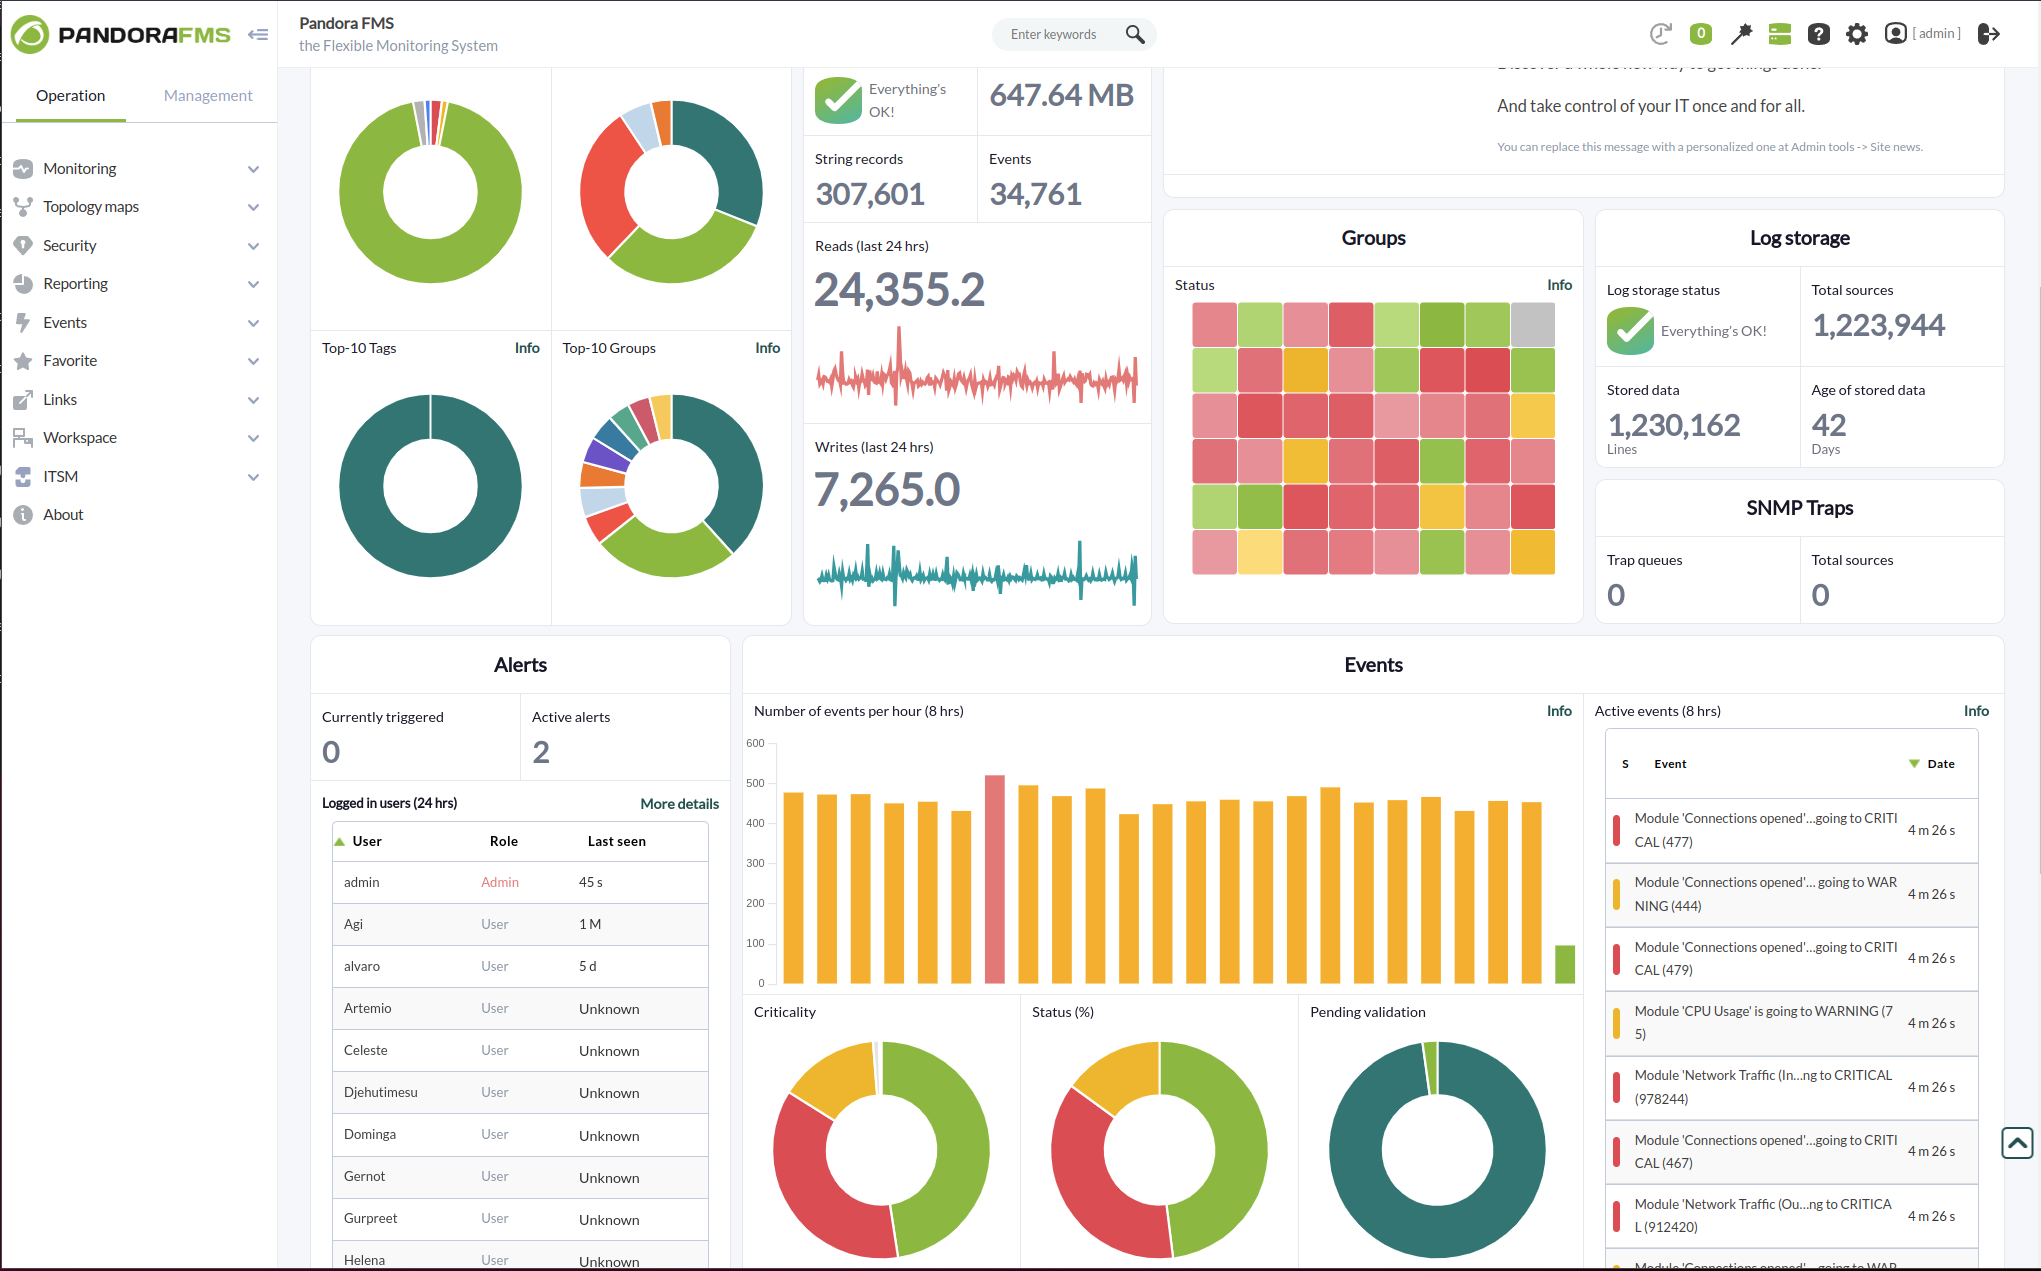
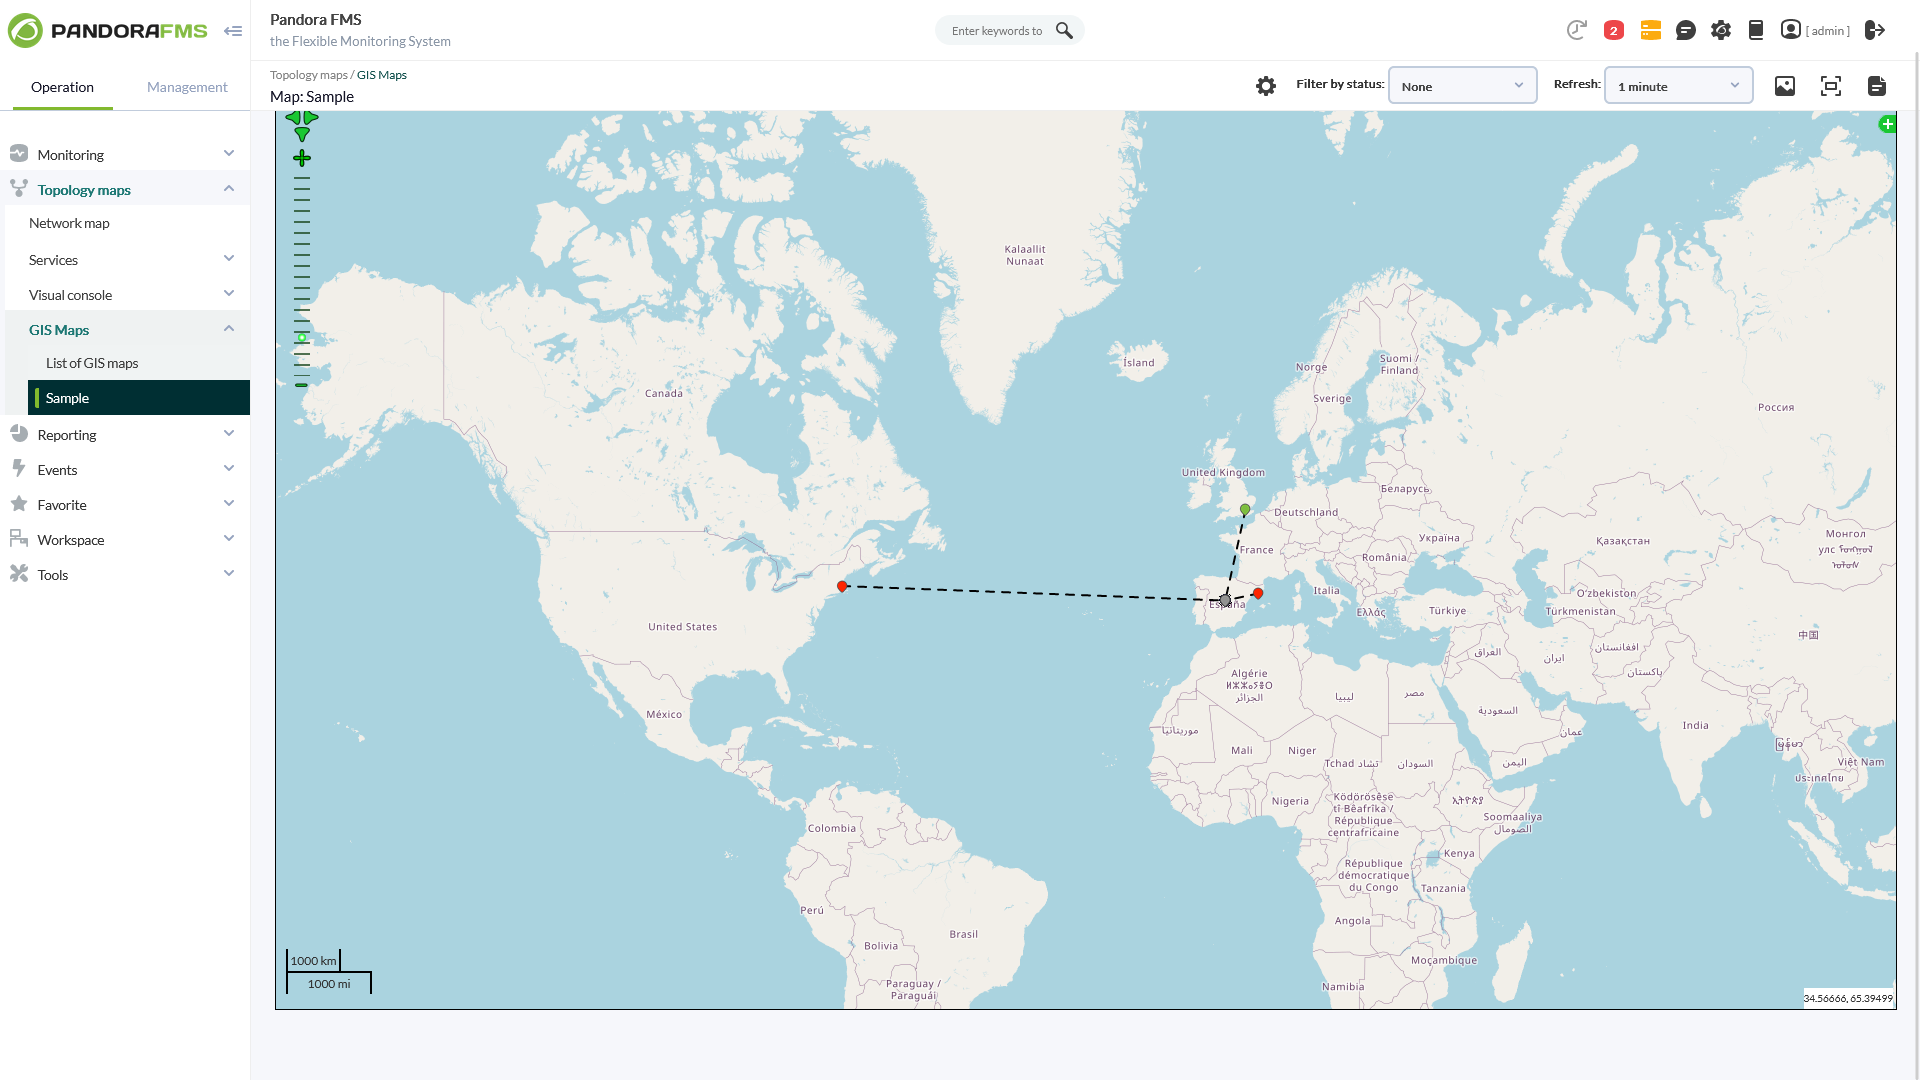
With more than 50,000 customer installations across the five continents, Pandora FMS is a truly all-in-one monitoring solution, covering all traditional silos for specific monitoring: servers, networks, applications, logs, synthetic/transactional, remote control, inventory, etc.
Pandora FMS allows you to quickly find and solve problems. It scales them so that they can be derived either from on-premise, multi-cloud, or both. You now have the ability to use your entire IT stack and analytics to solve any problem, even those that are difficult to find.
You can control and manage any technology and application with more than 500 plugins, including SAP, Oracle, Lotus or Citrix, Jboss, VMware, AWS and SQL Server.
API Access
Has API
No
API Access
Has API
Yes




Integrations
Alfresco Digital Business Platform
No
Amazon Web Services (AWS)
No
Aruba Cloud
No
Azure Marketplace
No
BizTalk Server
No
Grafana Cloud
No
IBM Informix
No
JBoss EAP
No
Kubernetes
No
Nutanix AHV
No
Integrations
Alfresco Digital Business Platform
Yes
Amazon Web Services (AWS)
Yes
Aruba Cloud
Yes
Azure Marketplace
Yes
BizTalk Server
Yes
Grafana Cloud
Yes
IBM Informix
Yes
JBoss EAP
Yes
Kubernetes
Yes
Nutanix AHV
Yes
Pricing Details
$5.00/month
Free Trial
No
Free Version
Yes
Pricing Details
€90/month
On-premise, SaaS and subscription models available.
Free Trial
Yes
Free Version
Yes
Deployment
Web-Based
Yes
On-Premises
No
iPhone App
No
iPad App
No
Android App
No
Windows
No
Mac
No
Linux
No
Chromebook
No
Deployment
Web-Based
Yes
On-Premises
Yes
iPhone App
Yes
iPad App
Yes
Android App
Yes
Windows
Yes
Mac
Yes
Linux
Yes
Chromebook
No
Customer Support
Business Hours
No
Live Rep (24/7)
No
Online Support
Yes
Customer Support
Business Hours
Yes
Live Rep (24/7)
Yes
Online Support
Yes
Types of Training
Training Docs
Yes
Webinars
Yes
Live Training (Online)
Yes
In Person
Yes
Types of Training
Training Docs
Yes
Webinars
Yes
Live Training (Online)
Yes
In Person
Yes
Vendor Details
Company Name
Expected Behavior
Founded
2007
Country
United States
Website
www.expectedbehavior.com/products/instrumental/
Vendor Details
Company Name
Pandora FMS
Founded
2005
Country
Spain
Website
pandorafms.com
Product Features
Application Performance Monitoring (APM)
Baseline Manager
Yes
Diagnostic Tools
Yes
Full Transaction Diagnostics
No
Performance Control
Yes
Resource Management
Yes
Root-Cause Diagnosis
No
Server Performance
Yes
Trace Individual Transactions
No
Product Features
Business Activity Monitoring
Alerts / Notifications
Yes
Business Process Management
Yes
Cross Application Analysis
No
Email Monitoring
Yes
Events Monitoring
Yes
KPI Monitoring
Yes
Pre-Configured Events
No
Reporting / Analytics
Yes
Workflow Management
No
Cloud Management
Access Control
No
Billing & Provisioning
No
Capacity Analytics
Yes
Cost Management
Yes
Demand Monitoring
Yes
Multi-Cloud Management
No
Performance Analytics
Yes
SLA Management
Yes
Supply Monitoring
Yes
Workflow Approval
No
Database Monitoring
Anomaly Detection
No
Autodiscovery
Yes
Capacity Planning
Yes
Dashboard
Yes
Dependency Tracking
Yes
Historical Trend Analysis
Yes
Multitenancy
Yes
Notifications / Alerts
Yes
Performance Monitoring
Yes
Permissions / Access Controls
Yes
Predictive Analytics
Yes
Prioritization
Yes
Query Analysis
Yes
Resource Optimization
Yes
Troubleshooting
Yes
IT Alerting
Alert Noise Reduction
Yes
Alert Routing
Yes
Dynamic Notifications
Yes
Enriched Incident Context
Yes
Escalation Policies
Yes
Incident History Audit
Yes
Multi-User Alerting
Yes
Multiple Alert Types
Yes
On-Call Management
No
Rich HTML Email Notifications
Yes
IT Infrastructure Monitoring
Alerts / Notifications
Yes
Application Monitoring
Yes
Bandwidth Monitoring
Yes
Capacity Planning
Yes
Configuration Change Management
Yes
Data Movement Monitoring
Yes
Health Monitoring
Yes
Multi-Platform Support
Yes
Performance Monitoring
Yes
Point-in-Time Visibility
Yes
Reporting / Analytics
Yes
Virtual Machine Monitoring
Yes
Network Mapping
Color Codes / Icons
Yes
Compliance Management
No
Device Auto Discovery
Yes
Hierarchical Mapping
Yes
Location-Based Mapping
No
Map Exporting
No
On-Demand Mapping
Yes
Reporting/Analytics
Yes
Self-Updating Maps
Yes
Web Traffic Reporting
No
Network Monitoring
Bandwidth Monitoring
Yes
Baseline Manager
Yes
Diagnostic Tools
Yes
IP Address Monitoring
Yes
Internet Usage Monitoring
Yes
Real Time Analytics
Yes
Resource Management
Yes
SLA Monitoring
Yes
Server Monitoring
Yes
Uptime Monitoring
Yes
Web Traffic Reporting
Yes
RMM
Deployment Management
Yes
For MSPs
Yes
IT Asset Management
Yes
Mobile Access
No
Network Monitoring
Yes
Patch Management
Yes
Real-time Alerts
Yes
Remediation Management
Yes
Server Management
CPU Monitoring
Yes
Credential Management
No
Database Servers
Yes
Email Monitoring
Yes
Event Logs
Yes
History Tracking
Yes
Patch Management
Yes
Scheduling
Yes
User Activity Monitoring
No
Virtual Machine Monitoring
Yes
System Monitoring
Alerts / Notifications
Yes
Antivirus Management
Yes
Data Backup / Recovery
Yes
Device Monitoring
Yes
Inventory Management
Yes
Patch Management
Yes
Policy-based Automation
Yes
Remote Monitoring
Yes
Reporting / Analytics
Yes
Risk Analysis
Yes
Server Monitoring
Yes
Service Configuration Management
Yes
Website Monitoring
Availability Testing
Yes
Event Logs
Yes
Event-Based Notifications
Yes
FTP Monitoring
Yes
Mail Server Monitoring
Yes
Maintenance Scheduling
Yes
Performance Metrics
Yes
Real Time Monitoring
Yes
Transaction Monitoring
Yes
Uptime Reporting
Yes
