Average Ratings 0 Ratings
Average Ratings 27 Ratings
Similar Products
-
New RelicAround 25 million engineers work across dozens of distinct functions. Engineers are using New Relic as every company is becoming a software company to gather real-time insight and trending data on the performance of their software. This allows them to be more resilient and provide exceptional customer experiences. New Relic is the only platform that offers an all-in one solution. New Relic offers customers a secure cloud for all metrics and events, powerful full-stack analytics tools, and simple, transparent pricing based on usage. New Relic also has curated the largest open source ecosystem in the industry, making it simple for engineers to get started using observability.
-
AdRem NetCrunchNetCrunch is a next-gen, agentless infrastructure and traffic network monitoring system designed for hybrid, multi-site, and fast changing infrastructures. It combines real-time observability with alert automation and intelligent escalation to eliminate the overhead and limitations of legacy tools like PRTG or SolarWinds. NetCrunch supports agentless monitoring of thousands of nodes from a single server-covering physical devices, virtual machines, servers, traffic flows, cloud services (AWS, Azure, GCP), SNMP, syslogs, Windows Events, IoT, telemetry, and more. Unlike sensor-based tools, NetCrunch uses node-based licensing and policy-driven configuration to streamline monitoring, reduce costs, and eliminate sensor micromanagement. 670+ built-in monitoring packs apply instantly based on device type, ensuring consistency across the network. NetCrunch delivers real-time, dynamic maps and dashboards that update without manual refreshes, giving users immediate visibility into issues and performance. Its smart alerting engine features root cause correlation, suppression, predictive triggers, and over 40 response actions including scripts, API calls, notifications, and integrations with Jira, Teams, Slack, Amazon SNS, MQTT, PagerDuty, and more. Its powerful REST API makes NetCrunch perfect for flow automation, including integration with asset management, production/IoT/operations monitoring and other IT systems with ease. Whether replacing an aging platform or modernizing enterprise observability, NetCrunch offers full-stack coverage with unmatched flexibility. Fast to deploy, simple to manage, and built to scale-NetCrunch is the smarter, faster, and future-ready monitoring system. Designed for on-prem (including air-gapped), cloud self-hosted or hybrid networks.
-
Grafana CloudGrafana Labs delivers the leading AI-powered observability platform, built around Grafana—the most widely adopted open source technology for dashboards and visualization. Recognized as a Leader in the 2025 Gartner® Magic Quadrant™ for Observability Platforms, Grafana Labs supports more than 25 million users and thousands of organizations worldwide, from startups to Fortune 500 enterprises. Grafana Cloud is the open observability cloud, designed to help engineering teams observe everything and solve anything. Built on open source, open standards, and open ecosystems, it unifies metrics, logs, traces, and profiles in a single platform for full-stack visibility across applications, infrastructure, and digital experiences. At the core is the open-source LGTM stack: Grafana for dashboards and visualization, Mimir for metrics, Loki for logs, and Tempo for distributed tracing. Native OpenTelemetry and Prometheus support allow teams to ingest telemetry from virtually any environment, while hundreds of integrations connect existing tools and data sources without costly rip-and-replace migrations. Grafana Cloud combines powerful analytics with AI-driven observability. Grafana Assistant helps engineers investigate issues, explore telemetry, and troubleshoot faster. Adaptive Telemetry identifies the data that matters most and aggregates the rest, helping organizations reduce telemetry costs while preserving valuable insights . With solutions for Kubernetes monitoring, application observability, digital experience monitoring, incident response, synthetic monitoring, and performance testing, Grafana Cloud delivers a complete observability platform that scales with your business.
-
AuvikAuvik Network Management is a network management and monitoring software designed to empower IT professionals with deep visibility, automation, and control over their network infrastructure. This innovative platform is trusted by businesses of all sizes to streamline network operations, enhance security, and optimize performance. One of Auvik's standout features is its real-time network mapping and discovery capabilities. It automatically generates interactive, visual maps of your network topology, allowing you to easily identify devices, connections, and potential bottlenecks. This invaluable insight helps in planning and optimizing network architecture for maximum efficiency.
-
NinjaOneNinjaOne automates the hardest parts of IT, empowering more than 20,000 IT teams. By providing deep insights into endpoints, robust security measures, and centralized control, NinjaOne boosts efficiency while safeguarding sensitive data and cutting IT expenses. This comprehensive platform offers a versatile toolkit for managing and securing endpoints, including patch management, mobile device oversight, software distribution, remote support, backup solutions, and more, thanks to its extensive IT and security integrations.
-
Uptime.comUptime.com website monitoring solutions provide unmatched visibility and availability, empowering engineering, operations and SRE teams to monitor & respond to their most essential services. Simple & intuitive industry leading Enterprise-grade features delivered at a fair price, that are continuously improving. G2, Sourceforge and TechRadar Pro have recognized us as one of the world’s best uptime monitors for several consecutive years, including this one. Try 100% free.
-
AteraThe all-in-one IT management platform, powered by Action AI™ Atera is the all-in-one IT management platform that combines RMM, Helpdesk, and ticketing with AI to boost organizational efficiency at scale. Try Atera Free Now!
-
ManageEngine Log360Log360 is a SIEM or security analytics solution that helps you combat threats on premises, in the cloud, or in a hybrid environment. It also helps organizations adhere to compliance mandates such as PCI DSS, HIPAA, GDPR and more. You can customize the solution to cater to your unique use cases and protect your sensitive data. With Log360, you can monitor and audit activities that occur in your Active Directory, network devices, employee workstations, file servers, databases, Microsoft 365 environment, cloud services and more. Log360 correlates log data from different devices to detect complex attack patterns and advanced persistent threats. The solution also comes with a machine learning based behavioral analytics that detects user and entity behavior anomalies, and couples them with a risk score. The security analytics are presented in the form of more than 1000 pre-defined, actionable reports. Log forensics can be performed to get to the root cause of a security challenge. The built-in incident management system allows you to automate the remediation response with intelligent workflows and integrations with popular ticketing tools.
-
ManageEngine EventLog AnalyzerEventLog Analyzer from Manage Engine is the industry's most affordable security information and event management software (SIEM). This cloud-based, secure solution provides all essential SIEM capabilities, including log analysis, log consolidation, user activity monitoring and file integrity monitoring. It also supports event correlation, log log forensics and log retention. Real-time alerting is possible with this powerful and secure solution. Manage Engine's EventLog Analyzer allows users to prevent data breaches, detect the root cause of security issues, and mitigate sophisticated cyber-attacks.
-
GraylogGraylog is the AI-powered SIEM and log management platform built to help security and IT operations teams work faster, stay focused, and stay in control. It brings together all your event data in one place so teams can detect real threats quickly, investigate efficiently, and manage data costs predictably—without compromise. Graylog’s explainable AI turns noise into clarity, highlighting what matters most and guiding analysts through consistent, confident response steps. Its open, flexible architecture adapts to any environment, empowering organizations to scale and evolve without being locked into rigid systems or unpredictable pricing. With Graylog Security, Enterprise, API Security, and Open, more than 60,000 organizations worldwide rely on Graylog to deliver faster insight, simpler operations, and a smarter path to SIEM without compromise.
Description
Coralogix is the most popular stateful streaming platform, providing engineering teams with real-time insight and long-term trend analysis without relying on storage or indexing.
To manage, monitor, alert, and manage your applications, you can import data from any source. Coralogix automatically narrows the data from millions of events to common patterns, allowing for faster troubleshooting and deeper insights.
Machine learning algorithms constantly monitor data patterns and flows among system components and trigger dynamic alarms to let you know when a pattern is out of the norm without the need for static thresholds or pre-configurations.
Connect any data in any format and view your insights anywhere, including our purpose-built UI and Kibana, Grafana as well as SQL clients and Tableau. You can also use our CLI and full API support.
Coralogix has successfully completed the relevant privacy and security compliances by BDO, including SOC 2, PCI and GDPR.
Description
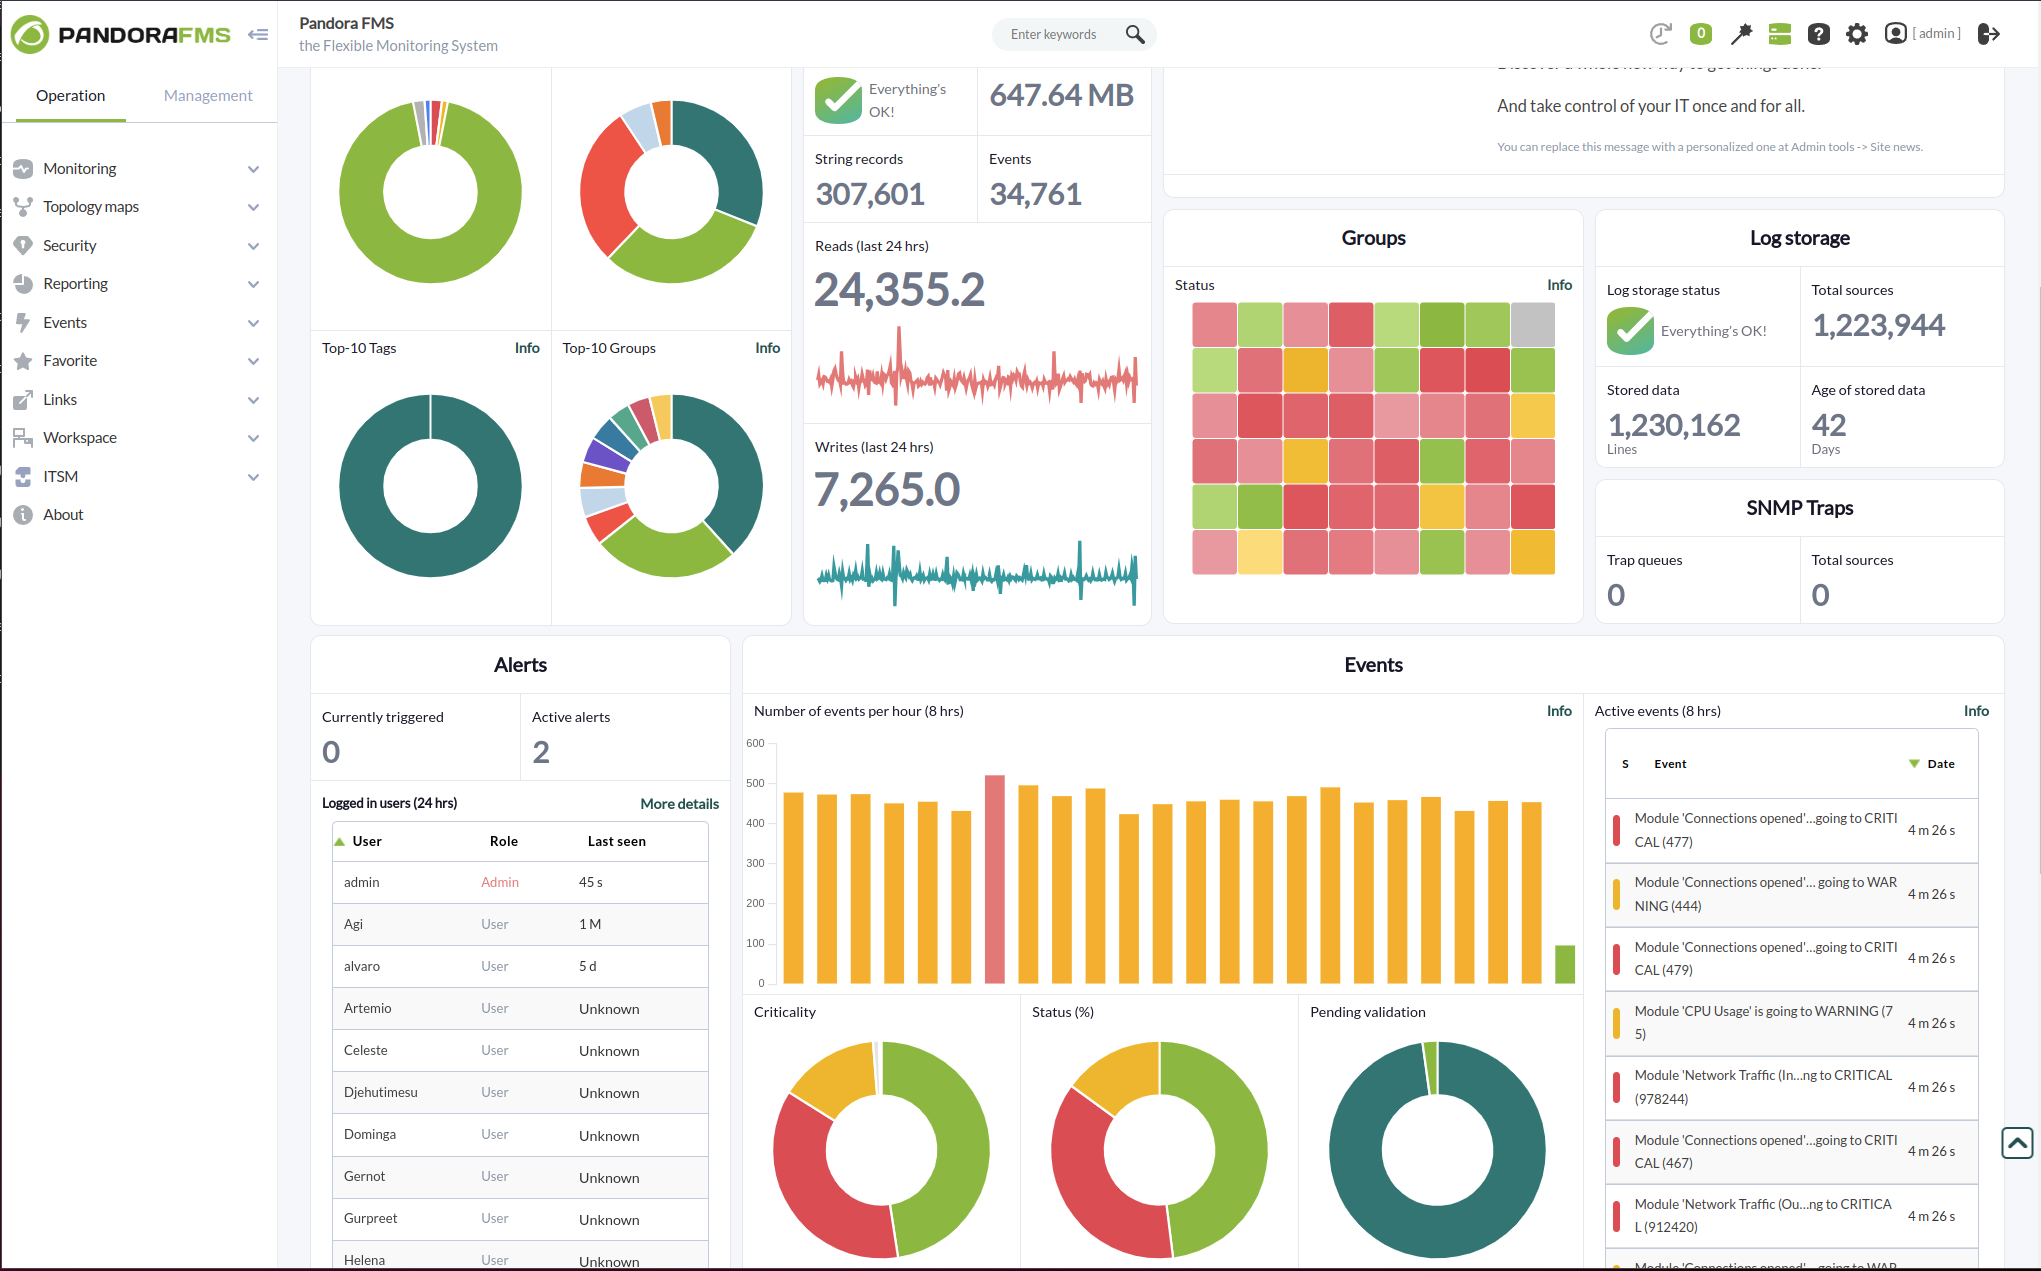
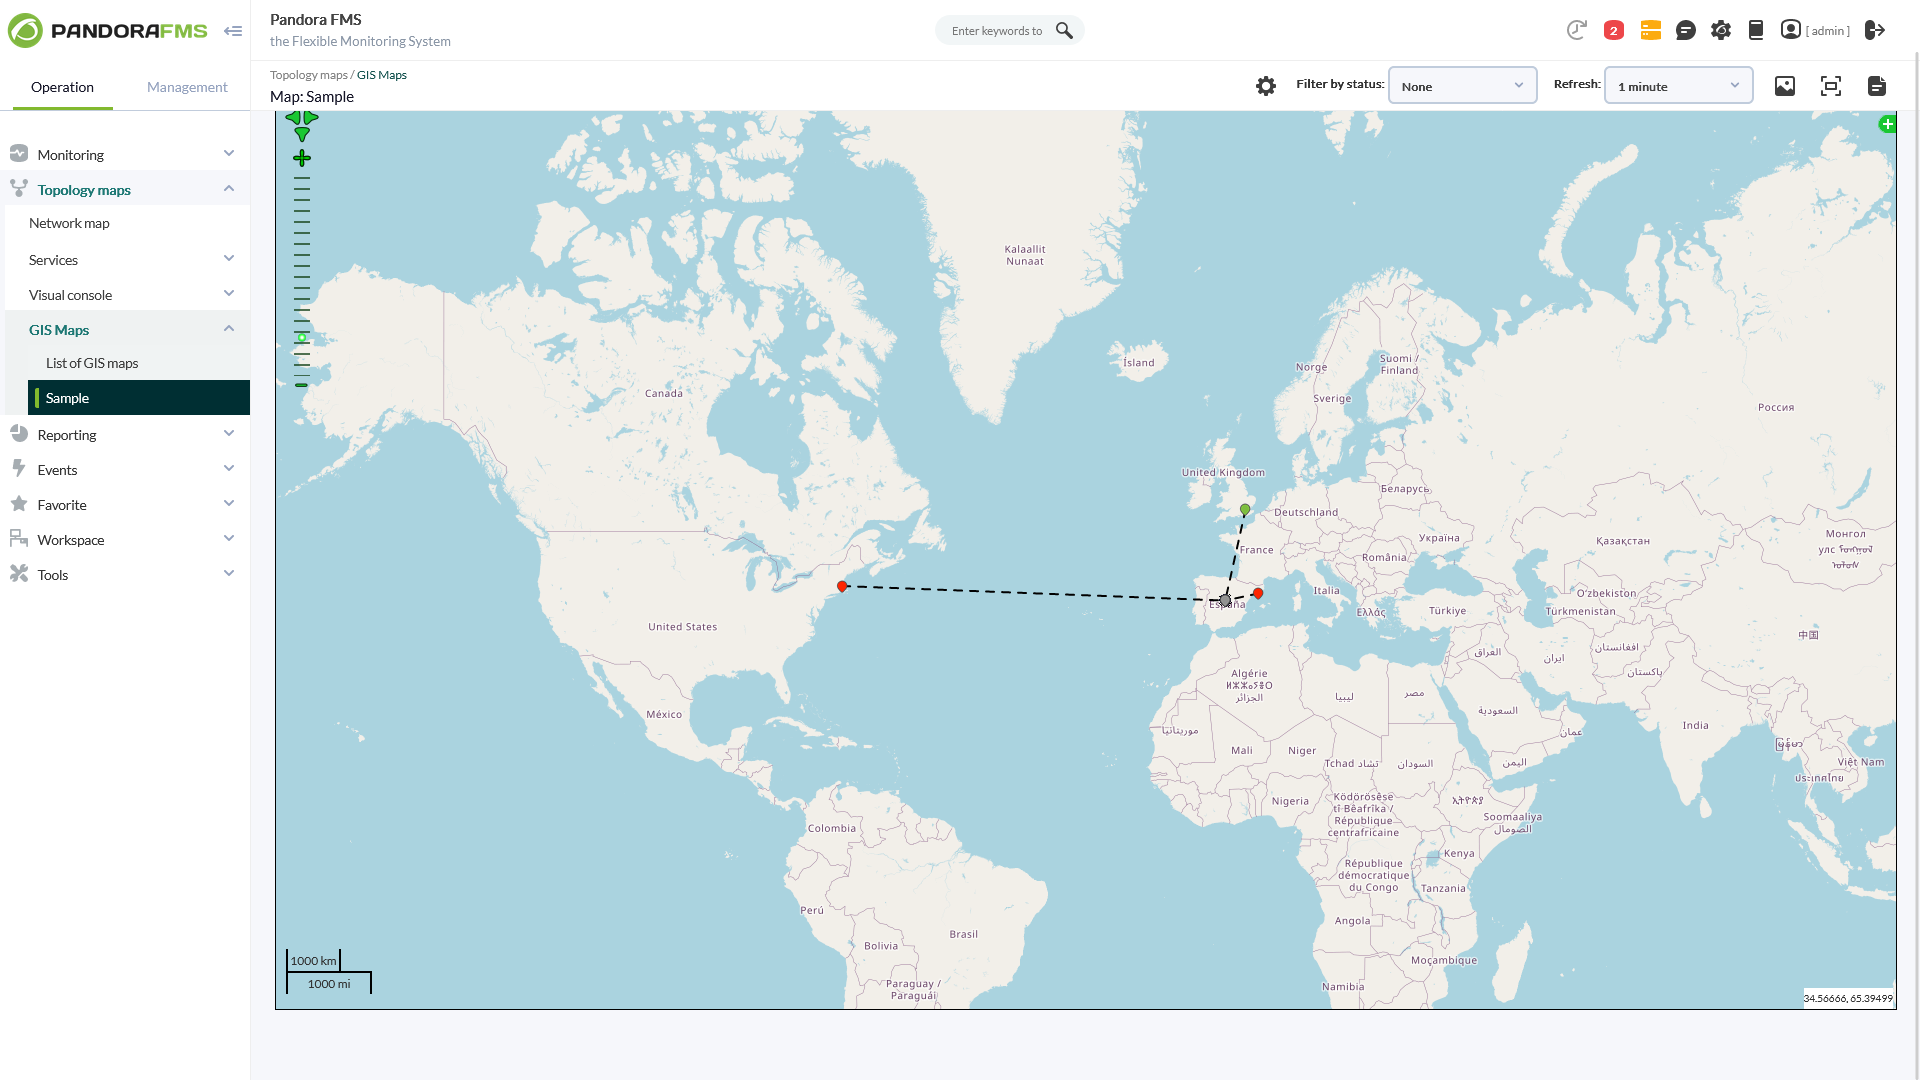
With more than 50,000 customer installations across the five continents, Pandora FMS is a truly all-in-one monitoring solution, covering all traditional silos for specific monitoring: servers, networks, applications, logs, synthetic/transactional, remote control, inventory, etc.
Pandora FMS allows you to quickly find and solve problems. It scales them so that they can be derived either from on-premise, multi-cloud, or both. You now have the ability to use your entire IT stack and analytics to solve any problem, even those that are difficult to find.
You can control and manage any technology and application with more than 500 plugins, including SAP, Oracle, Lotus or Citrix, Jboss, VMware, AWS and SQL Server.
API Access
Has API
API Access
Has API


Integrations
Kubernetes
Amazon CloudWatch
Amazon Kinesis
Azure Functions
Bitbucket
BizTalk Server
CircleCI
Cisco Nexus Dashboard Fabric Controller
Cron To Go
GitHub
Integrations
Kubernetes
Amazon CloudWatch
Amazon Kinesis
Azure Functions
Bitbucket
BizTalk Server
CircleCI
Cisco Nexus Dashboard Fabric Controller
Cron To Go
GitHub
Pricing Details
No price information available.
Free Trial
Free Version
Pricing Details
€90/month
Free Trial
Free Version
Deployment
Web-Based
On-Premises
iPhone App
iPad App
Android App
Windows
Mac
Linux
Chromebook
Deployment
Web-Based
On-Premises
iPhone App
iPad App
Android App
Windows
Mac
Linux
Chromebook
Customer Support
Business Hours
Live Rep (24/7)
Online Support
Customer Support
Business Hours
Live Rep (24/7)
Online Support
Types of Training
Training Docs
Webinars
Live Training (Online)
In Person
Types of Training
Training Docs
Webinars
Live Training (Online)
In Person
Vendor Details
Company Name
Coralogix
Founded
2015
Country
United States
Website
coralogix.com
Vendor Details
Company Name
Pandora FMS
Founded
2005
Country
Spain
Website
pandorafms.com
Product Features
Application Performance Monitoring (APM)
Baseline Manager
Diagnostic Tools
Full Transaction Diagnostics
Performance Control
Resource Management
Root-Cause Diagnosis
Server Performance
Trace Individual Transactions
Cloud Management
Access Control
Billing & Provisioning
Capacity Analytics
Cost Management
Demand Monitoring
Multi-Cloud Management
Performance Analytics
SLA Management
Supply Monitoring
Workflow Approval
Data Management
Customer Data
Data Analysis
Data Capture
Data Integration
Data Migration
Data Quality Control
Data Security
Information Governance
Master Data Management
Match & Merge
DevOps
Approval Workflow
Dashboard
KPIs
Policy Management
Portfolio Management
Prioritization
Release Management
Timeline Management
Troubleshooting Reports
IT Infrastructure Monitoring
Alerts / Notifications
Application Monitoring
Bandwidth Monitoring
Capacity Planning
Configuration Change Management
Data Movement Monitoring
Health Monitoring
Multi-Platform Support
Performance Monitoring
Point-in-Time Visibility
Reporting / Analytics
Virtual Machine Monitoring
IT Management
Capacity Monitoring
Compliance Management
Event Logs
Hardware Inventory
IT Budgeting
License Management
Patch Management
Remote Access
Scheduling
Software Inventory
User Activity Monitoring
Log Management
Archiving
Audit Trails
Compliance Reporting
Consolidation
Data Visualization
Event Logs
Network Logs
Remediation
Syslogs
Thresholds
Web Logs
Network Monitoring
Bandwidth Monitoring
Baseline Manager
Diagnostic Tools
IP Address Monitoring
Internet Usage Monitoring
Real Time Analytics
Resource Management
SLA Monitoring
Server Monitoring
Uptime Monitoring
Web Traffic Reporting
System Monitoring
Alerts / Notifications
Antivirus Management
Data Backup / Recovery
Device Monitoring
Inventory Management
Patch Management
Policy-based Automation
Remote Monitoring
Reporting / Analytics
Risk Analysis
Server Monitoring
Service Configuration Management
Website Monitoring
Availability Testing
Event Logs
Event-Based Notifications
FTP Monitoring
Mail Server Monitoring
Maintenance Scheduling
Performance Metrics
Real Time Monitoring
Transaction Monitoring
Uptime Reporting
Product Features
Business Activity Monitoring
Alerts / Notifications
Business Process Management
Cross Application Analysis
Email Monitoring
Events Monitoring
KPI Monitoring
Pre-Configured Events
Reporting / Analytics
Workflow Management
Cloud Management
Access Control
Billing & Provisioning
Capacity Analytics
Cost Management
Demand Monitoring
Multi-Cloud Management
Performance Analytics
SLA Management
Supply Monitoring
Workflow Approval
Database Monitoring
Anomaly Detection
Autodiscovery
Capacity Planning
Dashboard
Dependency Tracking
Historical Trend Analysis
Multitenancy
Notifications / Alerts
Performance Monitoring
Permissions / Access Controls
Predictive Analytics
Prioritization
Query Analysis
Resource Optimization
Troubleshooting
IT Alerting
Alert Noise Reduction
Alert Routing
Dynamic Notifications
Enriched Incident Context
Escalation Policies
Incident History Audit
Multi-User Alerting
Multiple Alert Types
On-Call Management
Rich HTML Email Notifications
IT Infrastructure Monitoring
Alerts / Notifications
Application Monitoring
Bandwidth Monitoring
Capacity Planning
Configuration Change Management
Data Movement Monitoring
Health Monitoring
Multi-Platform Support
Performance Monitoring
Point-in-Time Visibility
Reporting / Analytics
Virtual Machine Monitoring
Network Mapping
Color Codes / Icons
Compliance Management
Device Auto Discovery
Hierarchical Mapping
Location-Based Mapping
Map Exporting
On-Demand Mapping
Reporting/Analytics
Self-Updating Maps
Web Traffic Reporting
Network Monitoring
Bandwidth Monitoring
Baseline Manager
Diagnostic Tools
IP Address Monitoring
Internet Usage Monitoring
Real Time Analytics
Resource Management
SLA Monitoring
Server Monitoring
Uptime Monitoring
Web Traffic Reporting
RMM
Deployment Management
For MSPs
IT Asset Management
Mobile Access
Network Monitoring
Patch Management
Real-time Alerts
Remediation Management
Server Management
CPU Monitoring
Credential Management
Database Servers
Email Monitoring
Event Logs
History Tracking
Patch Management
Scheduling
User Activity Monitoring
Virtual Machine Monitoring
System Monitoring
Alerts / Notifications
Antivirus Management
Data Backup / Recovery
Device Monitoring
Inventory Management
Patch Management
Policy-based Automation
Remote Monitoring
Reporting / Analytics
Risk Analysis
Server Monitoring
Service Configuration Management
Website Monitoring
Availability Testing
Event Logs
Event-Based Notifications
FTP Monitoring
Mail Server Monitoring
Maintenance Scheduling
Performance Metrics
Real Time Monitoring
Transaction Monitoring
Uptime Reporting