Look, solar irradiance averages about 1366 W/m^2 and a has a variation of about 1 W/m^2 (using a one-year moving average). That's 0.073%.
You are referring to the Total Solar Irradiance (TSI). But it is not total: the satellites used to measure it have a spectral window from 2000 nm down to 200nm. That leaves out the EUV and X-Ray region. There, the variation is huge. See for example this factor-of-three variation over the solar cycle in the 26-34 nm band.
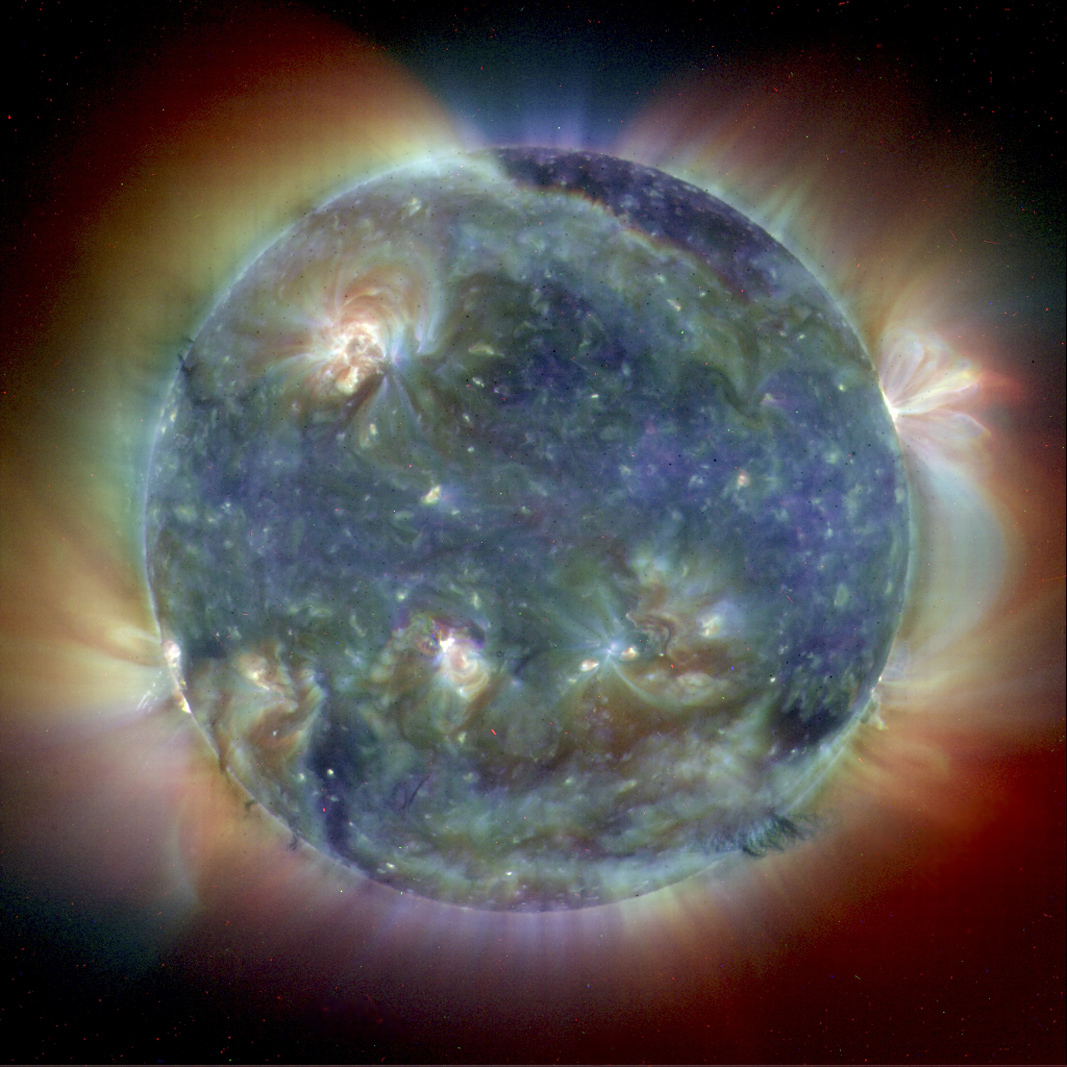
In the X-ray region variations can be orders of magnitude. Looking at any EUV of X-ray image, it is obvious that the short wavelength intensity from the corona much exceeds the black body radiation coming off the surface. So the conventional view that the EUV and X-Ray region is just an irrelevant tail of the black-body curve is wrong:the flux there is much more intense.
Then there are serious doubts about whether the TSI time series as published are actually all that constant. There have been per-instrument aging calibrations that have removed slopes in the raw data. The question though is whether this slope was really due to aging or due to a systematic trend in the solar irradiance. Also, the long-term TSI curve spans a number of instruments (satellites) with some gap in between. There is a lot of discussion about whether this gap has been bridged without skewing the data towards less variance than there really is.
There. A tiny bit more research shows that the sun can have a rather greater effect on Earth's temperature than it is given credit for.
And no, climate scientists are not familiar with this. The importance of the EUV and X-Ray region has been overlooked in the past and only recently has started to gain attention.
