Average Ratings 0 Ratings
Average Ratings 27 Ratings
Average Ratings 0 Ratings
Similar Products
-
AdRem NetCrunchNetCrunch is a next-gen, agentless infrastructure and traffic network monitoring system designed for hybrid, multi-site, and fast changing infrastructures. It combines real-time observability with alert automation and intelligent escalation to eliminate the overhead and limitations of legacy tools like PRTG or SolarWinds. NetCrunch supports agentless monitoring of thousands of nodes from a single server-covering physical devices, virtual machines, servers, traffic flows, cloud services (AWS, Azure, GCP), SNMP, syslogs, Windows Events, IoT, telemetry, and more. Unlike sensor-based tools, NetCrunch uses node-based licensing and policy-driven configuration to streamline monitoring, reduce costs, and eliminate sensor micromanagement. 670+ built-in monitoring packs apply instantly based on device type, ensuring consistency across the network. NetCrunch delivers real-time, dynamic maps and dashboards that update without manual refreshes, giving users immediate visibility into issues and performance. Its smart alerting engine features root cause correlation, suppression, predictive triggers, and over 40 response actions including scripts, API calls, notifications, and integrations with Jira, Teams, Slack, Amazon SNS, MQTT, PagerDuty, and more. Its powerful REST API makes NetCrunch perfect for flow automation, including integration with asset management, production/IoT/operations monitoring and other IT systems with ease. Whether replacing an aging platform or modernizing enterprise observability, NetCrunch offers full-stack coverage with unmatched flexibility. Fast to deploy, simple to manage, and built to scale-NetCrunch is the smarter, faster, and future-ready monitoring system. Designed for on-prem (including air-gapped), cloud self-hosted or hybrid networks.
-
ManageEngine OpManagerOpManager is the ideal end-to-end network monitoring tool for your organization's network. With OpManager, you can keep a close eye on health, performance, and availability levels of all network devices. This includes monitoring switches, routers, LANs, WLCs, IP addresses and firewalls. Insights into your hardware health and performance; monitor CPU, memory, temperature, disk usage, and more to improve efficiency. Seamlessly manage faults and alerts with instant notifications and detailed logs. Streamlined workflows facilitate easy set-up to execute quick diagnosis and corrective measures. The solution also comes with powerful visualization tools such as business views, 3d data center views, topology maps, heat maps, and customizable dashboards. Get proactive in capacity planning and decision-making with over 250 predefined reports covering all important metrics and areas in your network. Overall, OpManager's detailed management capabilities make it the ideal solution for IT administrators to achieve network resiliency and efficiency.
-
Site24x7Site24x7 provides unified cloud monitoring to support IT operations and DevOps within small and large organizations. The solution monitors real users' experiences on websites and apps from both desktop and mobile devices. DevOps teams can monitor and troubleshoot applications and servers, as well as network infrastructure, including private clouds and public clouds, with in-depth monitoring capabilities. Monitoring the end-user experience is done from more 100 locations around the globe and via various wireless carriers.
-
AteraThe all-in-one IT management platform, powered by Action AI™ Atera is the all-in-one IT management platform that combines RMM, Helpdesk, and ticketing with AI to boost organizational efficiency at scale. Try Atera Free Now!
-
NinjaOneNinjaOne automates the hardest parts of IT, empowering more than 20,000 IT teams. By providing deep insights into endpoints, robust security measures, and centralized control, NinjaOne boosts efficiency while safeguarding sensitive data and cutting IT expenses. This comprehensive platform offers a versatile toolkit for managing and securing endpoints, including patch management, mobile device oversight, software distribution, remote support, backup solutions, and more, thanks to its extensive IT and security integrations.
-
PathSolutions TotalViewTotalView offers network monitoring as well as root-cause troubleshooting of problems in plain-English. The solution monitors every device as well as every interface on every device. In addition, TotalView goes deep, collecting 19 error counters, performance, configuration, and connectedness so nothing is outside of it’s view. A built-in heuristics engine analyzes this information to produce plain-English answers to problems. Complex problems can now be solved by junior level engineers leaving the senior level engineers to work on more strategic level projects. The core product includes everything needed to run a perfectly healthy network: Configuration management, server monitoring, cloud service monitoring, IPAM, NetFlow, path mapping, and diagramming. Get Total Network Visibility on your network and solve more problems faster.
-
DomotzDiscover why MSPs, IT Professionals, and System Integrators trust our Network Monitoring and Management Solution to monitor thousands of networks worldwide. Try for free now!
-
ConnectWise AutomateConnectWise Automate makes it easy to solve IT problems at lightning speed. ConnectWise Automate is a robust platform for remote monitoring and management (RMM). It helps IT teams increase their effectiveness. It allows teams to identify all devices and users that require proactive monitoring, remove delivery roadblocks and support more endpoints without adding to their workloads.
-
New RelicAround 25 million engineers work across dozens of distinct functions. Engineers are using New Relic as every company is becoming a software company to gather real-time insight and trending data on the performance of their software. This allows them to be more resilient and provide exceptional customer experiences. New Relic is the only platform that offers an all-in one solution. New Relic offers customers a secure cloud for all metrics and events, powerful full-stack analytics tools, and simple, transparent pricing based on usage. New Relic also has curated the largest open source ecosystem in the industry, making it simple for engineers to get started using observability.
-
NetBrainSince 2004, NetBrain has transformed network operations with its no-code automation platform, helping teams systematically shift left by turning complex processes into streamlined workflows. By unifying AI and automation, NetBrain delivers actionable hybrid network-wide observability, automates troubleshooting, and enables safe change management to boost efficiency, reduce MTTR, and mitigate risk, enabling IT organizations to proactively drive innovation. Get network-wide and contextualized analysis across your multi-vendor, multi-cloud network Visualize and document the entire hybrid network using dynamic network maps and end-to-end paths Automate network discovery and ensure data accuracy for a single source of truth Auto-discover and decode your network's golden configurations, discover day 1 issues, and automate configuration drift prevention Automate pre- and post-validations for network changes with application performance context understanding Automate collaborative troubleshooting from human to machine
Description
Dynamic scalability is essential for effective data processing, allowing the monitoring of numerous data points through a distributed, tiered architecture. An event-driven framework enhances the capabilities of service polling and data collection, enabling versatile integration of workflows. OpenNMS serves as a robust open-source network monitoring tool that allows users to visualize and oversee their local and distributed networks seamlessly. With a focus on comprehensive fault detection, performance evaluation, traffic oversight, and alarm generation, OpenNMS consolidates these capabilities into a single platform. Its high level of customization and scalability ensures that OpenNMS can be effectively integrated with essential business applications and workflows, making it a vital asset for organizations aiming to optimize their network management. This adaptability enhances the overall efficiency of monitoring processes, ensuring that businesses can respond swiftly to network challenges.
Description
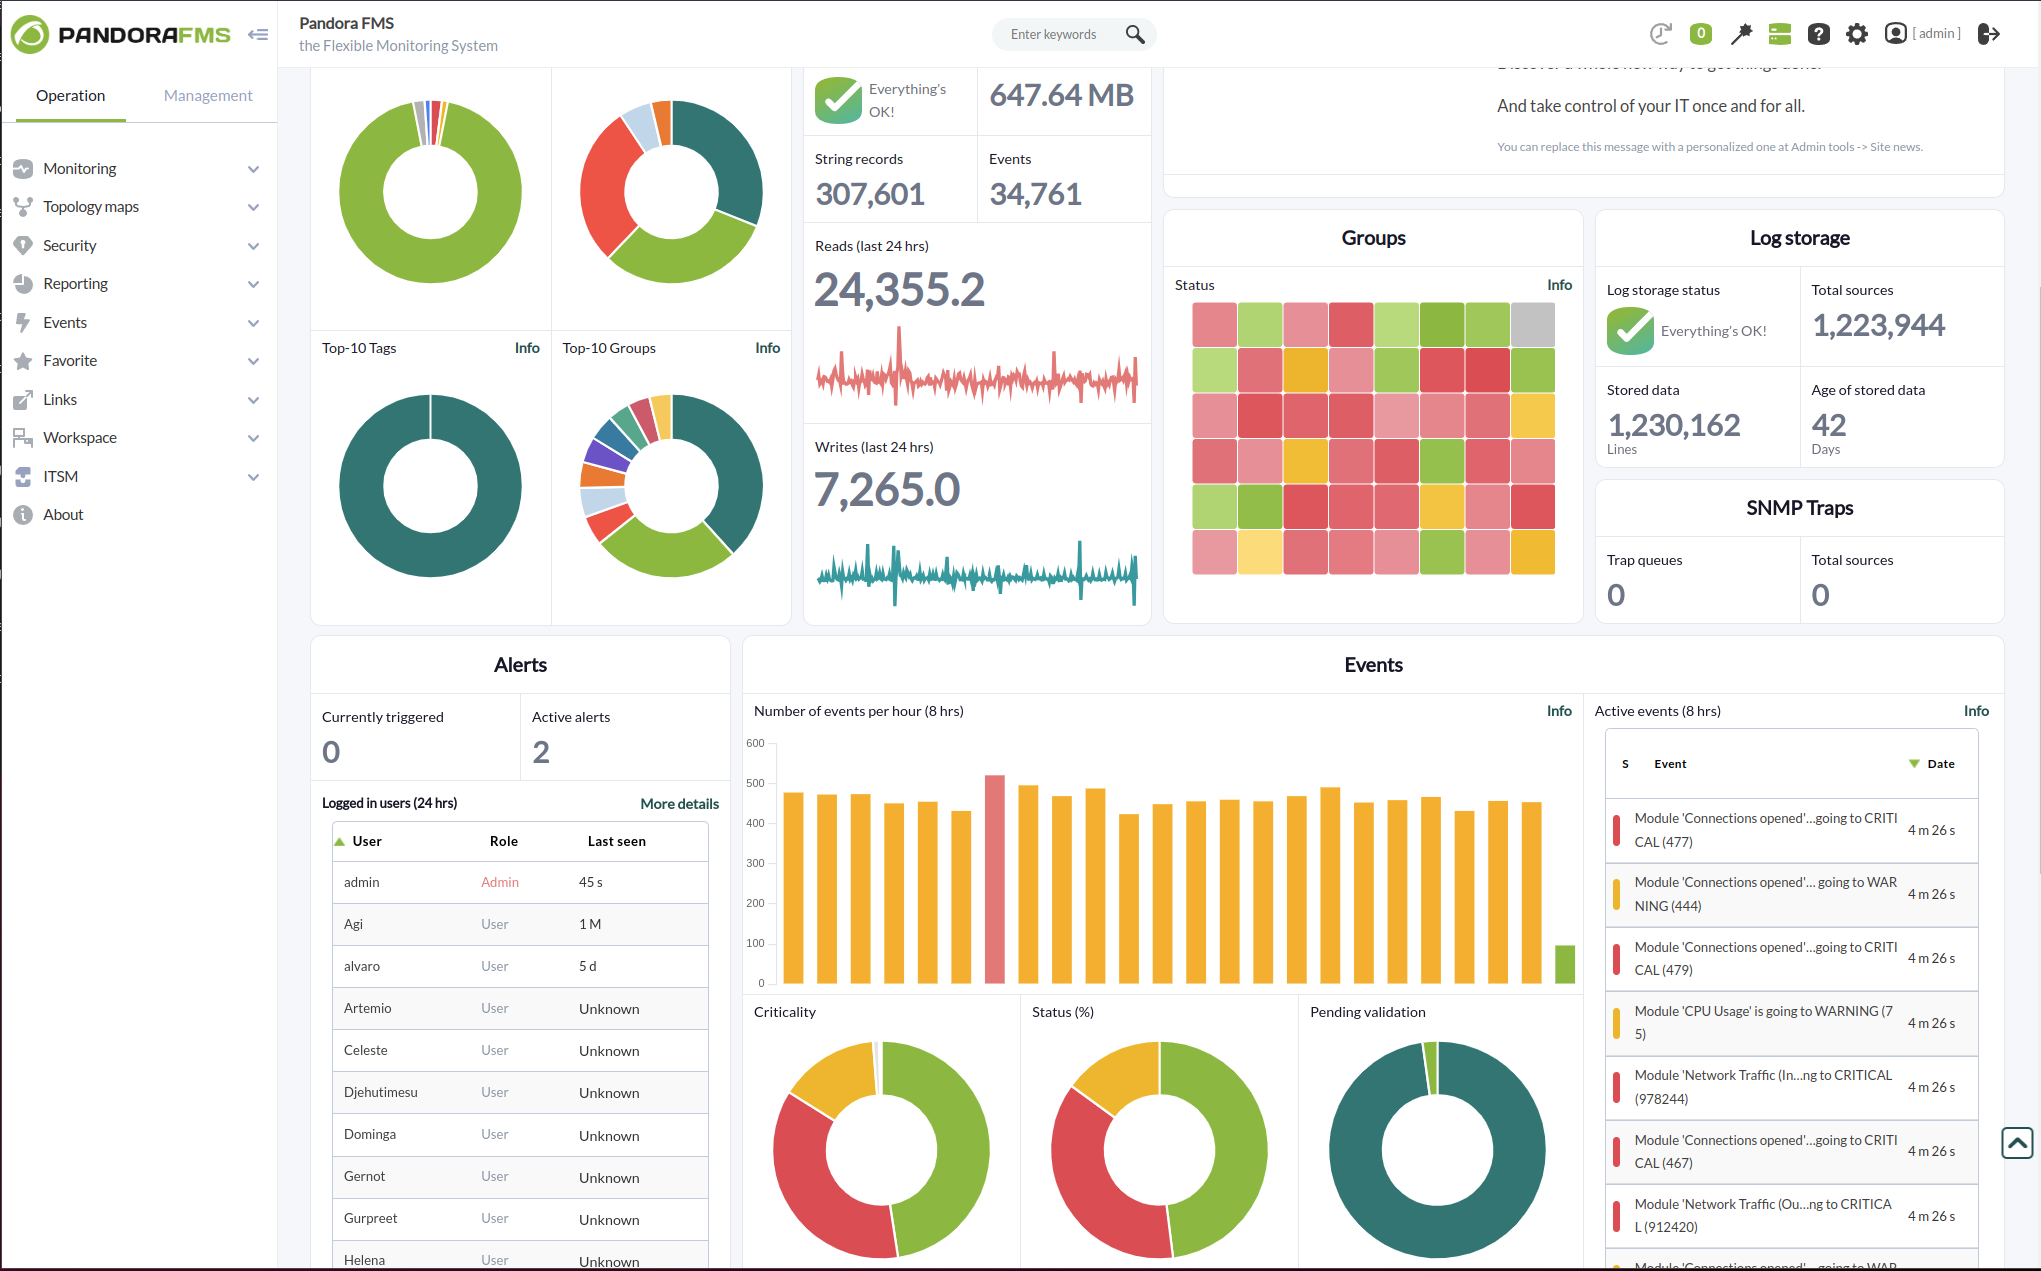
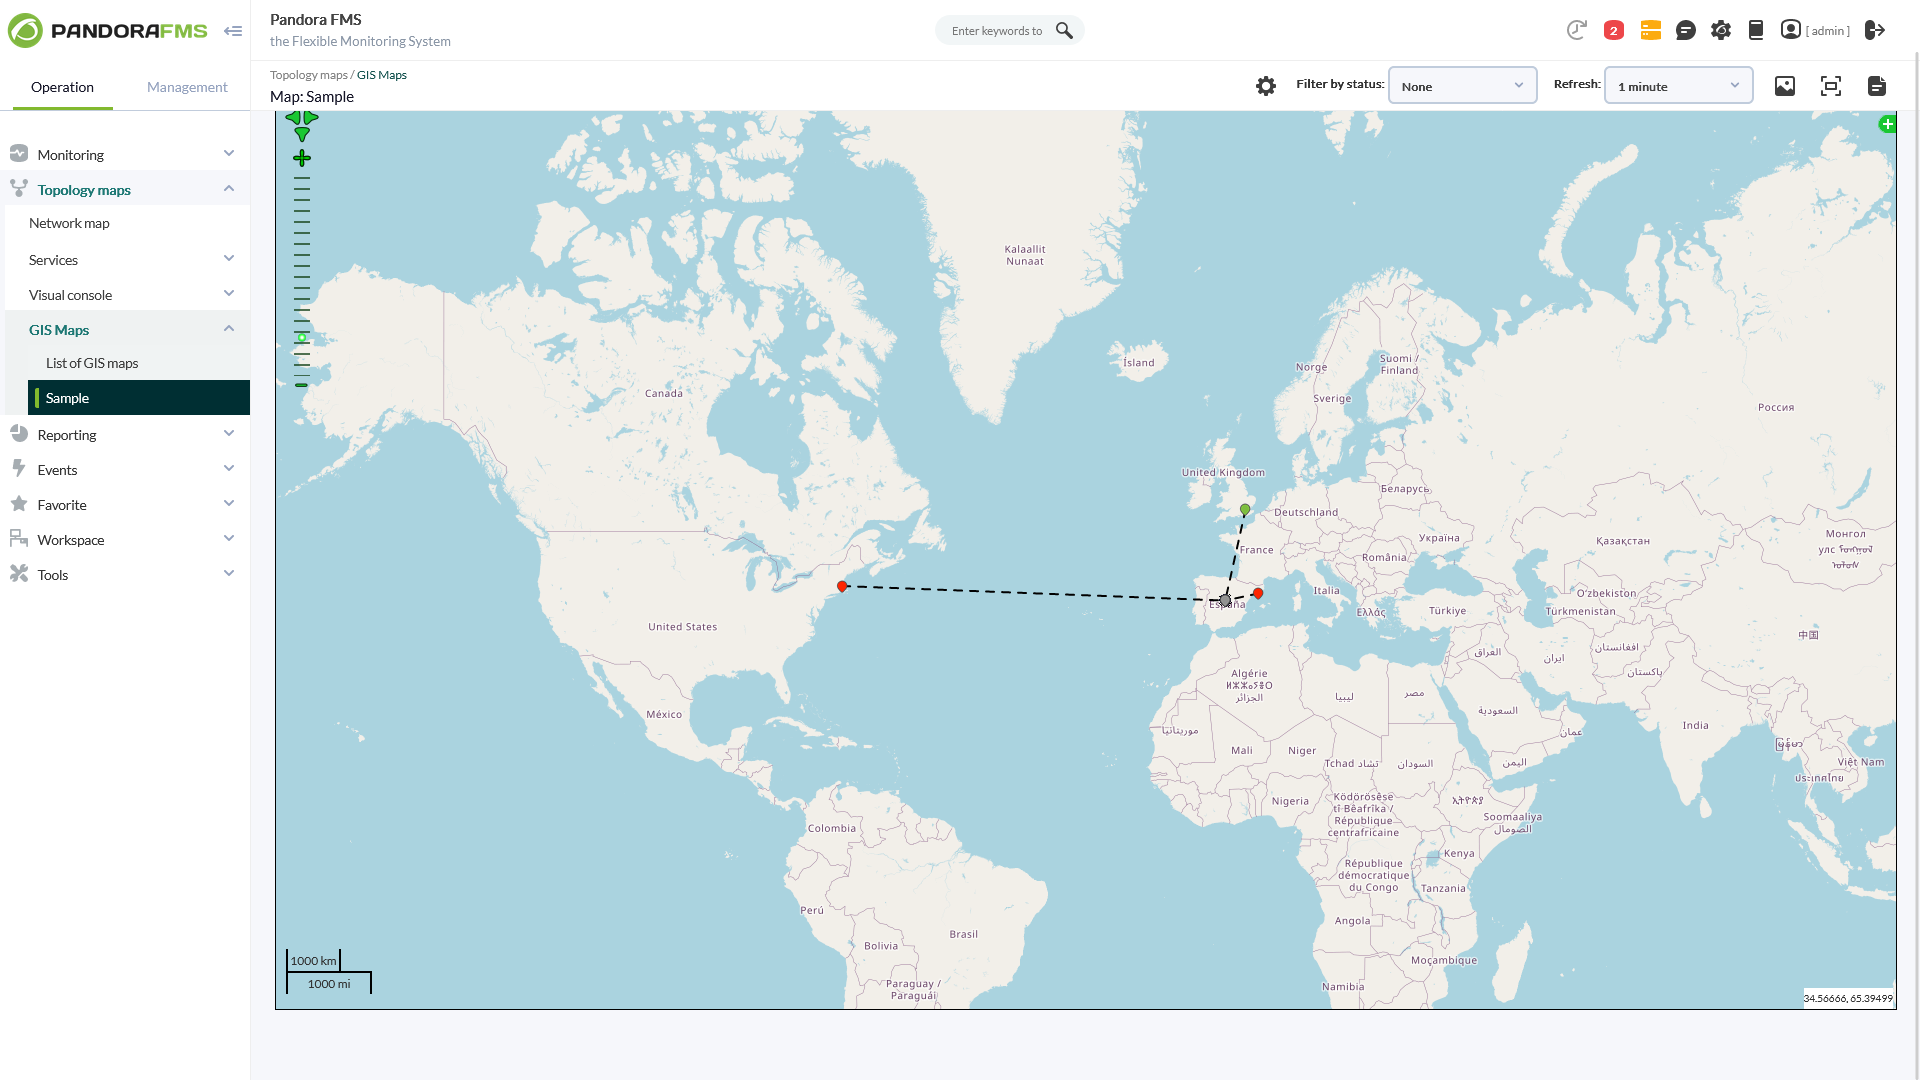
With more than 50,000 customer installations across the five continents, Pandora FMS is a truly all-in-one monitoring solution, covering all traditional silos for specific monitoring: servers, networks, applications, logs, synthetic/transactional, remote control, inventory, etc.
Pandora FMS allows you to quickly find and solve problems. It scales them so that they can be derived either from on-premise, multi-cloud, or both. You now have the ability to use your entire IT stack and analytics to solve any problem, even those that are difficult to find.
You can control and manage any technology and application with more than 500 plugins, including SAP, Oracle, Lotus or Citrix, Jboss, VMware, AWS and SQL Server.
Description
Enhance your metrics and alerting capabilities using a top-tier open-source monitoring tool. Prometheus inherently organizes all data as time series, which consist of sequences of timestamped values associated with the same metric and a specific set of labeled dimensions. In addition to the stored time series, Prometheus has the capability to create temporary derived time series based on query outcomes. The tool features a powerful query language known as PromQL (Prometheus Query Language), allowing users to select and aggregate time series data in real time. The output from an expression can be displayed as a graph, viewed in tabular format through Prometheus’s expression browser, or accessed by external systems through the HTTP API. Configuration of Prometheus is achieved through a combination of command-line flags and a configuration file, where the flags are used to set immutable system parameters like storage locations and retention limits for both disk and memory. This dual method of configuration ensures a flexible and tailored monitoring setup that can adapt to various user needs. For those interested in exploring this robust tool, further details can be found at: https://sourceforge.net/projects/prometheus.mirror/
API Access
Has API
API Access
Has API
API Access
Has API


Integrations
Hadoop
MongoDB
Akamai
Amazon Elastic Container Service (Amazon ECS)
Apache CouchDB
Apolo
Chkk
Deductive AI
HostAccess
Kops.dev
Integrations
Hadoop
MongoDB
Akamai
Amazon Elastic Container Service (Amazon ECS)
Apache CouchDB
Apolo
Chkk
Deductive AI
HostAccess
Kops.dev
Integrations
Hadoop
MongoDB
Akamai
Amazon Elastic Container Service (Amazon ECS)
Apache CouchDB
Apolo
Chkk
Deductive AI
HostAccess
Kops.dev
Pricing Details
No price information available.
Free Trial
Free Version
Pricing Details
€90/month
Free Trial
Free Version
Pricing Details
Free
Free Trial
Free Version
Deployment
Web-Based
On-Premises
iPhone App
iPad App
Android App
Windows
Mac
Linux
Chromebook
Deployment
Web-Based
On-Premises
iPhone App
iPad App
Android App
Windows
Mac
Linux
Chromebook
Deployment
Web-Based
On-Premises
iPhone App
iPad App
Android App
Windows
Mac
Linux
Chromebook
Customer Support
Business Hours
Live Rep (24/7)
Online Support
Customer Support
Business Hours
Live Rep (24/7)
Online Support
Customer Support
Business Hours
Live Rep (24/7)
Online Support
Types of Training
Training Docs
Webinars
Live Training (Online)
In Person
Types of Training
Training Docs
Webinars
Live Training (Online)
In Person
Types of Training
Training Docs
Webinars
Live Training (Online)
In Person
Vendor Details
Company Name
The OpenNMS Group
Country
United States
Website
www.opennms.org
Vendor Details
Company Name
Pandora FMS
Founded
2005
Country
Spain
Website
pandorafms.com
Vendor Details
Company Name
Prometheus
Founded
2012
Website
prometheus.io
Product Features
Network Monitoring
Bandwidth Monitoring
Baseline Manager
Diagnostic Tools
IP Address Monitoring
Internet Usage Monitoring
Real Time Analytics
Resource Management
SLA Monitoring
Server Monitoring
Uptime Monitoring
Web Traffic Reporting
Product Features
Business Activity Monitoring
Alerts / Notifications
Business Process Management
Cross Application Analysis
Email Monitoring
Events Monitoring
KPI Monitoring
Pre-Configured Events
Reporting / Analytics
Workflow Management
Cloud Management
Access Control
Billing & Provisioning
Capacity Analytics
Cost Management
Demand Monitoring
Multi-Cloud Management
Performance Analytics
SLA Management
Supply Monitoring
Workflow Approval
Database Monitoring
Anomaly Detection
Autodiscovery
Capacity Planning
Dashboard
Dependency Tracking
Historical Trend Analysis
Multitenancy
Notifications / Alerts
Performance Monitoring
Permissions / Access Controls
Predictive Analytics
Prioritization
Query Analysis
Resource Optimization
Troubleshooting
IT Alerting
Alert Noise Reduction
Alert Routing
Dynamic Notifications
Enriched Incident Context
Escalation Policies
Incident History Audit
Multi-User Alerting
Multiple Alert Types
On-Call Management
Rich HTML Email Notifications
IT Infrastructure Monitoring
Alerts / Notifications
Application Monitoring
Bandwidth Monitoring
Capacity Planning
Configuration Change Management
Data Movement Monitoring
Health Monitoring
Multi-Platform Support
Performance Monitoring
Point-in-Time Visibility
Reporting / Analytics
Virtual Machine Monitoring
Network Mapping
Color Codes / Icons
Compliance Management
Device Auto Discovery
Hierarchical Mapping
Location-Based Mapping
Map Exporting
On-Demand Mapping
Reporting/Analytics
Self-Updating Maps
Web Traffic Reporting
Network Monitoring
Bandwidth Monitoring
Baseline Manager
Diagnostic Tools
IP Address Monitoring
Internet Usage Monitoring
Real Time Analytics
Resource Management
SLA Monitoring
Server Monitoring
Uptime Monitoring
Web Traffic Reporting
RMM
Deployment Management
For MSPs
IT Asset Management
Mobile Access
Network Monitoring
Patch Management
Real-time Alerts
Remediation Management
Server Management
CPU Monitoring
Credential Management
Database Servers
Email Monitoring
Event Logs
History Tracking
Patch Management
Scheduling
User Activity Monitoring
Virtual Machine Monitoring
System Monitoring
Alerts / Notifications
Antivirus Management
Data Backup / Recovery
Device Monitoring
Inventory Management
Patch Management
Policy-based Automation
Remote Monitoring
Reporting / Analytics
Risk Analysis
Server Monitoring
Service Configuration Management
Website Monitoring
Availability Testing
Event Logs
Event-Based Notifications
FTP Monitoring
Mail Server Monitoring
Maintenance Scheduling
Performance Metrics
Real Time Monitoring
Transaction Monitoring
Uptime Reporting
Product Features
Database
Backup and Recovery
Creation / Development
Data Migration
Data Replication
Data Search
Data Security
Database Conversion
Mobile Access
Monitoring
NOSQL
Performance Analysis
Queries
Relational Interface
Virtualization
IT Infrastructure Monitoring
Alerts / Notifications
Application Monitoring
Bandwidth Monitoring
Capacity Planning
Configuration Change Management
Data Movement Monitoring
Health Monitoring
Multi-Platform Support
Performance Monitoring
Point-in-Time Visibility
Reporting / Analytics
Virtual Machine Monitoring
Network Monitoring
Bandwidth Monitoring
Baseline Manager
Diagnostic Tools
IP Address Monitoring
Internet Usage Monitoring
Real Time Analytics
Resource Management
SLA Monitoring
Server Monitoring
Uptime Monitoring
Web Traffic Reporting
