Average Ratings 0 Ratings
Average Ratings 0 Ratings
Similar Products
-
Visual PlanningVisual Planning is a powerful scheduling and resource management tool that's simple to use. Visual Planning is used by thousands of organizations to share their schedules and work more efficiently together.
-
Zoho ProjectsProject management is as efficient as it gets. Zoho Projects, a cloud-based project management software, helps you plan and track your work efficiently. It also allows you to collaborate with your team from anywhere. To get things done on schedule, plan your project activities, assign work, manage your resources, and collaborate better with your team. Gantt charts can be used to create your project plan and track your tasks. Zoho Projects helps you keep track of your key tasks and their dependencies and shows you any deviations from your planned progress. Reduce time spent on repetitive tasks. Our project management software is easy to use, no matter how complex your process is. It has a drag-and drop interface that makes it easier to create and deploy new automations. The Projects timesheet module allows you to log both billable and unbilled hours. You can record every minute of your hardwork, manually or with timers. Our built-in integration with Zoho Invoice generates invoices.
-
Project InsightProject Insight is a project and portfolio management software for growing companies. It centralizes project data from across expanding teams and multiplying software systems to streamline workflows, automate processes, and help you make confident, data-driven decisions about your business. Project Insight also empowers you to manage work at the project, program, and portfolio levels–simultaneously. Identify priorities and keep work aligned with strategic objectives. Track cross-level progress, resources, budgets, and risks & take immediate action from a centralized hub that automatically notifies teams of adjustments. Integrate & sync project data between the software tools you are already using like Azure DevOps, Jira, Microsoft Project, and ServiceNow. Optimize cross-team workflows, reduce double-entry, and get a clear picture of capacity, progress, budgets, and risks across your organization.
-
JiraJira is a project management tool that allows you to plan and track the work of your entire team. Atlassian's Jira is the #1 tool for software development teams to plan and build great products. Jira is trusted by thousands of teams. It offers a range of tools to help plan, track, and release world-class software. It also allows you to capture and organize issues, assign work, and follow team activity. It integrates with leading developer software for end-toend traceability. Jira can help you break down big ideas into manageable steps, whether they are small projects or large cross-functional programs. Organize your work, create milestones and dependencies, and more. Linking work to goals allows everyone to see how their work contributes towards company objectives, and to stay aligned with what's important. Your next step, suggested by AI. Atlassian Intelligence automatically suggests tasks to help you get your big ideas done.
-
PlanfixThe Planfix platform allows organizations to manage their entire business online. Regardless of company size and industry, Planfix has something to offer as an excellent project and work management tool. With Planfix, your company gets a fully customizable management system, from process design to appearance. Planfix’s platform combines task and project management, CRM, sales, marketing, production, logistics, support service, accounting, and HR in one full-featured solution. Data is seamlessly transferred from one team to another - for example, a transaction at the implementation stage becomes a project and then is transferred to support. Planfix is equally well suited for businesses and non-profit organizations, public associations, or any other group of people working towards a common cause. Trusted by 7724 companies, automates business workflows of more than 68 000 users.
-
monday.commonday.com Work OS is a no-code work management platform that helps teams manage projects and workflows more efficiently. This software provides fully customizable solutions for a wide range of use-cases such as marketing, sales, operations, IT, HR, and many more. With monday.com you can easily plan, manage, and track every project in one place, with the help of time-saving and easy-to-use features such as automations, time tracking, document sharing, real-time collaboration, and more. Multiple visual board views such as Gantt, Kanban, and Cards help you prioritize, structure, and navigate tasks and projects the way that suits you and your team’s needs, while dashboards give a high-level overview of your progress and help you make data-driven decisions. In addition, integrations with apps such as Outlook, Microsoft Teams, Gmail, and Excel, allow you to easily continue working with your favorite tools directly within the platform. monday.com also offers dedicated solutions, such as monday dev and monday sales CRM, designed to answer the needs of specific industries.
-
GantticGanttic is a flexible drag-and-drop scheduler for resource planning. Its resource-centric Gantt charts provide a holistic view of your equipment, personnel, facilities, and vehicles, providing a clear understanding of who or what is engaged and when. Beyond its scheduling capabilities, Ganttic enables a deeper level of resource management and project portfolio oversight. Harness the power to optimize resource utilization, generate detailed reports, and establish project or resource-breakdown structures that streamline the planning process. Unlimited Custom Views help segment large resource pools, giving different managers the power to organize their teams and departments according to their own needs. Create unique data fields to incorporate data that matters, and ensuring the right resource is booked for the job. Easily share Views to facilitate collaboration among teams and stakeholders, while notifications, calendar syncs, and a mobile app keep the right individuals informed of any changes. With unlimited user access in all subscriptions, everyone stays up to date. Take advantage of a free 14 day trial with complimentary training and onboarding from our dedicated support team.
-
AppsmithAppsmith enables organizations to create custom internal applications quickly with minimal coding. The platform allows users to build applications by connecting data sources, APIs, and workflows through a user-friendly drag-and-drop interface. Appsmith's flexibility with JavaScript lets developers fully customize components, while the open-source architecture and enterprise security features ensure scalability and compliance. With self-hosting and cloud deployment options, businesses can choose the best setup for their needs, whether for simple dashboards or complex business applications. Appsmith offers a comprehensive solution for creating and deploying custom AI agents that can automate key business processes. Designed for sales, support, and people management teams, the platform allows companies to embed conversational agents into their systems. Appsmith's AI agents enhance operational efficiency by managing routine tasks, providing real-time insights, and boosting team productivity, all while leveraging secure data.
-
JOpt.TourOptimizerIf you are developing software for Logistics Dispatch Solutions, which contain challenges: -For staff dispatching, such as sales reps, mobile service, or workforce? -For truck shipment allocation in daily transportation and logistics (scheduling, tour optimization, etc.)? -For waste management and District Planning? -Generally, highly constrained problem sets? And your product does not have an automized optimization engine? Then JOpt is the perfect fit for your product and can help you to save money, time, and workforce, letting you concentrate on your core business. JOpt.TourOptimizer is an adaptable component to solve VRP, CVRP, and VRPTW class problems for any route optimization in logistics or similar fields. It comes as a Java library or in Docker Container utilizing the Spring Framework and Swagger.
-
WorksectionRevolutionize your project management with Worksection, the online project management tool that streamlines workflows and enhances team collaboration. Designed for teams of all sizes, Worksection’s user-friendly interface makes it accessible for everyone, not just IT professionals. Trusted by over 1,600 marketing agencies, design studios, software developers, law firms, and architectural offices, Worksection is perfect for handling complex projects with ease. Its built-in time tracking helps you effortlessly monitor billable hours, ensuring accurate client billing. With streamlined task management, Gantt charts for precise planning, Kanban boards to visualize progress, and centralized communication, Worksection keeps your projects on track from start to finish. Plus, detailed reports provide deep insights into your team's performance, helping you make informed decisions. Seamlessly integrate with tools like Slack, Google Drive, and Zapier to ensure a smooth workflow across all your platforms. Use friendly support to reach your goals as fast as possible. Sign up to transform your project management with Worksection.
Description
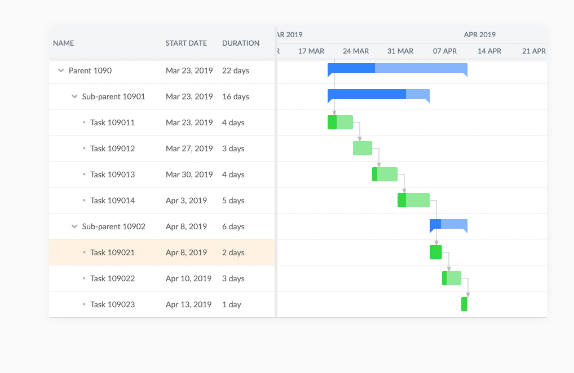
Bryntum stands out as a premier provider of advanced scheduling solutions designed for web applications. Our extensive collection of JavaScript components—featuring Gantt, Scheduler, Task Board, and Calendar—equips developers with the tools needed to create contemporary project management software that includes functionalities like drag-and-drop scheduling, efficient resource management, and dynamic timelines. With seamless compatibility with widely-used frameworks such as React, Angular, Vue, and Ext JS, we offer both flexibility and swift deployment. By enhancing planning processes and allowing for the visualization of intricate schedules, as well as optimizing resource utilization, Bryntum’s offerings enable organizations from various sectors to implement powerful and user-friendly project planning tools on a large scale. Ultimately, our commitment to innovation helps drive efficiency and effectiveness in project execution.
Description
JavaScript charting that is both straightforward and adaptable for designers and developers alike is now available. Users can arrange layout boxes in stacked and weighted configurations within groups. There's also a secondary title plugin that offers the same features as the primary title. Custom styling for line segments can be applied based on user-defined criteria. Each property of every element can have its transitions configured independently, allowing for detailed customization. Significant performance improvements have been made to enhance usability. Users can seamlessly combine bar and line charts to create a visually distinct representation of multiple datasets. The library supports the plotting of intricate and sparse datasets across various scales, including date time and logarithmic, as well as fully customizable options. It offers impressive transitions out of the box when modifying data, changing colors, or adding new datasets. Chart.js thrives as a community-driven project, encouraging contributions from users. With the ability to visualize data in eight unique, animated, and customizable formats, it redraws charts responsively when the window is resized, ensuring optimal scale granularity. Additionally, the latest version introduces new types of chart axes to expand its functionality even further.
API Access
Has API
API Access
Has API


Integrations
Angular
Embeddable
JavaScript
Noodl
QuickChart
React
Salesforce
Toddle
Vue.js
Integrations
Angular
Embeddable
JavaScript
Noodl
QuickChart
React
Salesforce
Toddle
Vue.js
Pricing Details
$680
Free Trial
Free Version
Pricing Details
Free
Free Trial
Free Version
Deployment
Web-Based
On-Premises
iPhone App
iPad App
Android App
Windows
Mac
Linux
Chromebook
Deployment
Web-Based
On-Premises
iPhone App
iPad App
Android App
Windows
Mac
Linux
Chromebook
Customer Support
Business Hours
Live Rep (24/7)
Online Support
Customer Support
Business Hours
Live Rep (24/7)
Online Support
Types of Training
Training Docs
Webinars
Live Training (Online)
In Person
Types of Training
Training Docs
Webinars
Live Training (Online)
In Person
Vendor Details
Company Name
Bryntum
Founded
2009
Country
Sweden
Website
www.bryntum.com
Vendor Details
Company Name
Chart.js
Website
www.chartjs.org
Product Features
Gantt Chart
Alerts/Notifications
Capacity Monitoring
Color Coding
Dependency Tracking
Drag & Drop
Milestone Tracking
Progress Tracking
Task Management
Templates
Kanban
Collaboration Tools
Dependency Tracking
KPI Monitoring
Milestone Tracking
Multi-Board
Prioritization
Project Planning
Roadmapping
Supports Scrum
Task Management
Time Tracking