Average Ratings 0 Ratings
Average Ratings 0 Ratings
Similar Products
-
HarmoniA powerful data analysis and visualization platform specifically designed for market research data. Harmoni can do it all, from data processing to analysis, reporting and visualization, as well as distribution, alerts and distribution. Spend less time processing data and more time analysing it. Harmoni automates your job. Harmoni makes it easy to share valuable and actionable insights with stakeholders. Although market research budgets are shrinking in number, expectations are increasing. Harmoni allows you to slice and dice data as the questions are asked. Harmoni allows you to combine multiple data sources into one usable set. Harmoni supports many data sources including IBM SPSS®, SQL and Microsoft Excel, CSV, tab delimited files, Dimensions and more. Harmoni is integrated with popular market research platforms such as Voxco and FocusVision Decipher.
-
Banker's DashboardAccess your bank's or credit union's financial performance from anywhere, anytime. Secure, cloud-based access gives you insight into your bank's financial performance. With a few clicks, you can access margin components, branch performance, forecasts, and more. The Banker's Dashboard and Credit Union Dashboard integrate seamlessly with your core processor. Easy setup allows you to immediately improve your bottom line. Automate reporting and eliminate errors so you can focus on higher-value tasks. Multiple forecast scenarios can be quickly run and revised, allowing you to analyze variances and other strategies. Compare branch performance. For better results, institute best practices and hold branches accountable.
-
SmartDrawSmartDraw makes professional drawings and diagrams accessible to everyone. Non-technical users can quickly create floor plans, while professionals get the precision and scale they require. With industry-leading floor planning tools and an intuitive interface for traditional diagramming like flowcharts and organizational charts, SmartDraw delivers enterprise-ready power without unnecessary complexity. Key features: - Large collection of symbols and templates - Ability to create custom shapes - Import PDFs, images, Google Maps, Visio files, Visio stencils - Draw to any scale - Enrich drawings with data - Generate manifest and bills of materials - Generate diagrams from data automatically like org charts, AWS, Azure, PI Boards, and more - Use natural language text prompts to generate diagrams with AI - Save files directly to OneDrive, SharePoint, or Google Drive, or other preferred provider - Integrations with the Microsoft and Google enterprise stack plus Confluence and Jira SmartDraw supports a wide range of industries and real-world use cases, helping teams plan, document, and communicate more effectively. Construction professionals use it to create scaled floor plans, site layouts, and electrical and plumbing drawings. Fire departments rely on it for fire pre-planning and incident documentation, while police departments use it for accident reconstruction and crime scene diagrams. IT teams build network diagrams and cloud architectures, HR leaders create organizational charts, and product managers map out processes and workflows. From physical layouts to business processes, SmartDraw provides a single platform that adapts to the needs of each role and industry.
-
SogolyticsSogolytics, an experience management platform, allows companies to collect, analyze and use employee and customer data to drive business growth. Sogolytics is used by organizations across all industries to track interactions at all touchpoints with customers and employees. The best-in-class reporting delivers real-time, actionable insights that help to prevent and mitigate potential problems. SogoCX improves every aspect of a company's customer experience. This means improved conversion rates, simplified data management, and understanding customers to increase return on investment. Organizations can use SogoCX to measure key metrics like NPS, CSAT and CES. SogoEX software is used by organizations to collect and use data to improve engagement and reduce turnover. This platform allows HR and leadership to drive organizational changes through real-time feedback collection and employee engagement.
-
GWIAnnually, we conduct surveys with over a million individuals worldwide, enabling businesses to swiftly grasp evolving consumer trends. Our user-friendly platform is tailored for busy teams, facilitating the extraction of essential information, customized analysis, and seamless sharing. Identify your ideal customer using more than 250,000 profiling metrics. Utilize question charts to gain insights into the thoughts, emotions, and actions of your audience. Aggregate data and visualizations to craft a compelling narrative for your team. Combine various data points for comprehensive analysis and deeper understanding. Access unparalleled insights into consumer behavior through survey results that capture the perspectives, interests, and actions of billions of individuals globally. We consistently pose the same survey questions across different regions, allowing for detailed insights into local markets while also providing a broader global perspective. Discover what consumers genuinely think about your brand and its competitors, gaining valuable insights into industry leaders and their market positions. This holistic approach ensures that businesses can navigate the complexities of consumer perception effectively.
-
D&B ConnectYour first-party data can be used to unlock its full potential. D&B Connect is a self-service, customizable master data management solution that can scale. D&B Connect's family of products can help you eliminate data silos and bring all your data together. Our database contains hundreds of millions records that can be used to enrich, cleanse, and benchmark your data. This creates a single, interconnected source of truth that empowers teams to make better business decisions. With data you can trust, you can drive growth and lower risk. Your sales and marketing teams will be able to align territories with a complete view of account relationships if they have a solid data foundation. Reduce internal conflict and confusion caused by incomplete or poor data. Segmentation and targeting should be strengthened. Personalization and quality of marketing-sourced leads can be improved. Increase accuracy in reporting and ROI analysis.
-
Shoplogix Smart Factory PlatformFor over two decades, Shoplogix has helped leading manufacturers worldwide unlock hidden production potential by transforming real-time machine and performance data into actionable insights. The platform automatically captures signals like downtime, scrap, and throughput, delivering visual dashboards that enable teams to identify bottlenecks, reduce losses, and improve continuously—both during shifts and in post-shift analysis. With OneSignal connectivity, Shoplogix integrates with any machine brand or type to deliver real-time, granular insights on slow-running, starved, or idle machines. Its intuitive visual management system allows operators and managers alike to quickly detect and act on issues. Integrated analytics provide powerful, slice-and-dice capabilities similar to leading BI tools, without leaving the platform. Designed for agility, Shoplogix supports scaling from a single line to multi-plant operations across geographies. Continuous improvement tools like Action Plans and Digital Andon alerts keep teams engaged, aligned, and empowered to act—making Shoplogix a powerful ally in the pursuit of operational excellence.
-
VaizVaiz is a work management platform built for small and mid-sized teams — startups, agencies, and growing SaaS companies — who want the structure of tools like Jira, Asana, or ClickUp without the complexity or price tag. It centralizes task management, document sharing, and team coordination in one lightweight workspace, so teams of 5-50 people can get started in minutes, not weeks. Vaiz offers customizable task boards (lists, Kanban, Gantt charts), an AI assistant that drafts, summarizes, and analyzes work, and built-in automation that handles routine tasks without extra setup. Integrations with tools like Slack, GitHub, and Google Workspace keep teams aligned without switching between apps. Vaiz scales with you, from a 5-person startup to a growing team, without forcing you to re-learn the tool as you grow."
-
PathSolutions TotalViewTotalView offers network monitoring as well as root-cause troubleshooting of problems in plain-English. The solution monitors every device as well as every interface on every device. In addition, TotalView goes deep, collecting 19 error counters, performance, configuration, and connectedness so nothing is outside of it’s view. A built-in heuristics engine analyzes this information to produce plain-English answers to problems. Complex problems can now be solved by junior level engineers leaving the senior level engineers to work on more strategic level projects. The core product includes everything needed to run a perfectly healthy network: Configuration management, server monitoring, cloud service monitoring, IPAM, NetFlow, path mapping, and diagramming. Get Total Network Visibility on your network and solve more problems faster.
-
ChatD&BDun & Bradstreet’s ChatD&B offers a powerful, AI-driven chat interface that simplifies how organizations research and assess companies. Instead of traditional complex filtering, users interact naturally by asking questions in their own words to receive tailored insights such as company financials, risk scores, and market data. The platform taps into the vast Dun & Bradstreet Data Cloud to deliver real-time, reliable information that supports smarter, faster business decisions. Enhanced features include visibility into the data sources behind results, chat history for audit trails, and quick answers to product-related queries. ChatD&B is designed to optimize workflows across sales, finance, and risk management by providing instant access to trusted company data. It helps teams discover new opportunities, evaluate customers, and make confident decisions all through easy chat conversations. The platform also enables better compliance and verification by allowing users to track and reference past interactions. With ChatD&B, organizations can accelerate growth and reduce operational friction.
Description
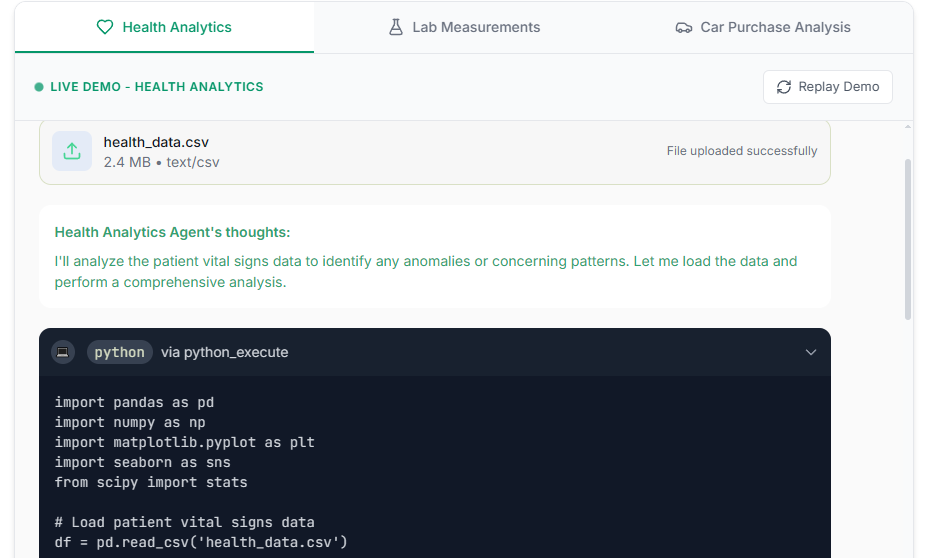
Splash AI is a data analytics and visualization platform powered by artificial intelligence, designed to help users easily convert raw data into actionable insights through natural-language queries, without the need for coding. Users can upload their datasets and simply request analyses in everyday language, resulting in immediate, usable outputs presented as interactive charts, tables, or comprehensive reports. The platform efficiently manages data cleaning, analysis, and visualization, providing tailored dashboards for various applications such as sales analytics (tracking performance and forecasting revenue), marketing ROI (evaluating campaign effectiveness and observing cohort trends), financial reporting (visualizing P&L flows with Sankey diagrams and understanding margin insights), and customer insights (offering segmented behavior dashboards and funnels). The streamlined process allows users to complete entire workflows—from data upload to generating insights—in just minutes, removing the need for complicated configurations. This efficiency not only saves time but also empowers users to make data-driven decisions faster than ever before.
Description
Custom Charts for Jira offers a versatile, no-code reporting solution that empowers teams to track their progress and identify obstacles without needing to master JQL. Users can create a variety of visualizations, including over ten types such as pie, bar, line, funnel, table, and tile charts, which can be seamlessly integrated into Jira dashboards. The application facilitates the creation of Agile, ITSM, and business reports by utilizing drag-and-drop functionality, color selection tools, and pre-designed templates. Additionally, it enables teams to monitor metrics like Time in Status, burnup, and burndown, while also allowing integration with Tempo Timesheets for comprehensive time tracking. Custom filtering options with personalized JQL, reporting on issue histories, and data retrieval from applications such as Structure and Xray enhance its capabilities. Furthermore, it collaborates with the Custom Charts Assistant Rovo agent to enable users to add charts to any Jira dashboard simply through natural-language commands, eliminating the need for field selection or JQL knowledge. Overall, Custom Charts is an essential component of Tempo's Strategic Portfolio Management (SPM) suite, providing a robust reporting framework that makes time, capacity, and portfolio data readily available to all users, complementing tools like Tempo Structure PPM, Timesheets, Capacity Planner, and Financial Manager. This integration ultimately streamlines reporting processes and enhances visibility across projects.
API Access
Has API
API Access
Has API

Screenshots View All
No images available
Integrations
Claude
GPT-4
Gemini
Gemini Enterprise
Google Sheets
JSON
Jira
Microsoft Excel
OpenAI
Python
Integrations
Claude
GPT-4
Gemini
Gemini Enterprise
Google Sheets
JSON
Jira
Microsoft Excel
OpenAI
Python
Pricing Details
$20 per month
Free Trial
Free Version
Pricing Details
No price information available.
Free Trial
Free Version
Deployment
Web-Based
On-Premises
iPhone App
iPad App
Android App
Windows
Mac
Linux
Chromebook
Deployment
Web-Based
On-Premises
iPhone App
iPad App
Android App
Windows
Mac
Linux
Chromebook
Customer Support
Business Hours
Live Rep (24/7)
Online Support
Customer Support
Business Hours
Live Rep (24/7)
Online Support
Types of Training
Training Docs
Webinars
Live Training (Online)
In Person
Types of Training
Training Docs
Webinars
Live Training (Online)
In Person
Vendor Details
Company Name
Splash AI
Country
United States
Website
aisplash.me/
Vendor Details
Company Name
Tempo
Founded
2009
Country
Iceland
Website
www.tempo.io
Product Features
Product Features
Dashboard
Annotations
Data Source Integrations
Functions / Calculations
Interactive
KPIs
OLAP
Private Dashboards
Public Dashboards
Scorecards
Themes
Visual Analytics
Widgets