Splash AI Description
Splash AI is a data analytics and visualization platform powered by artificial intelligence, designed to help users easily convert raw data into actionable insights through natural-language queries, without the need for coding. Users can upload their datasets and simply request analyses in everyday language, resulting in immediate, usable outputs presented as interactive charts, tables, or comprehensive reports. The platform efficiently manages data cleaning, analysis, and visualization, providing tailored dashboards for various applications such as sales analytics (tracking performance and forecasting revenue), marketing ROI (evaluating campaign effectiveness and observing cohort trends), financial reporting (visualizing P&L flows with Sankey diagrams and understanding margin insights), and customer insights (offering segmented behavior dashboards and funnels). The streamlined process allows users to complete entire workflows—from data upload to generating insights—in just minutes, removing the need for complicated configurations. This efficiency not only saves time but also empowers users to make data-driven decisions faster than ever before.
Pricing
Integrations
Company Details
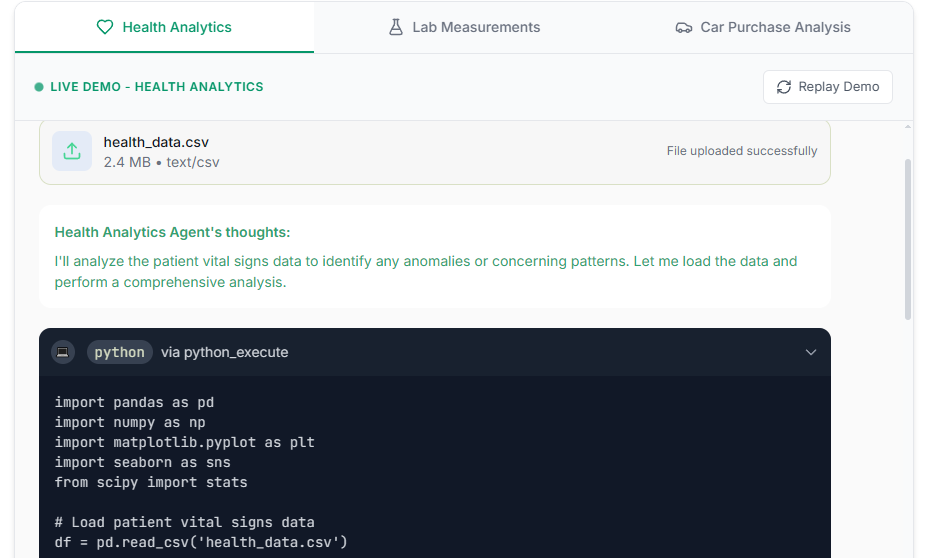
Media


Product Details
Splash AI Features and Options
Splash AI User Reviews
Write a Review- Previous
- Next
