Average Ratings 0 Ratings
Average Ratings 27 Ratings
Similar Products
-
Site24x7Site24x7 provides unified cloud monitoring to support IT operations and DevOps within small and large organizations. The solution monitors real users' experiences on websites and apps from both desktop and mobile devices. DevOps teams can monitor and troubleshoot applications and servers, as well as network infrastructure, including private clouds and public clouds, with in-depth monitoring capabilities. Monitoring the end-user experience is done from more 100 locations around the globe and via various wireless carriers.
-
AteraThe all-in-one IT management platform, powered by Action AI™ Atera is the all-in-one IT management platform that combines RMM, Helpdesk, and ticketing with AI to boost organizational efficiency at scale. Try Atera Free Now!
-
New RelicAround 25 million engineers work across dozens of distinct functions. Engineers are using New Relic as every company is becoming a software company to gather real-time insight and trending data on the performance of their software. This allows them to be more resilient and provide exceptional customer experiences. New Relic is the only platform that offers an all-in one solution. New Relic offers customers a secure cloud for all metrics and events, powerful full-stack analytics tools, and simple, transparent pricing based on usage. New Relic also has curated the largest open source ecosystem in the industry, making it simple for engineers to get started using observability.
-
LogicMonitorLogicMonitor is the leading SaaS-based, fully-automated observability platform for enterprise IT and managed service providers. Cloud-first and hybrid ready. LogicMonitor helps enterprises and managed service providers gain IT insights through comprehensive visibility into networks, cloud, applications, servers, log data and more within one unified platform. Drive collaboration and efficiency across IT and DevOps teams, in a fully secure, intelligently automated platform. By providing end-to-end observability for enterprise businesses, LogicMonitor connects coders to consumers, customer experience to the cloud, infrastructure to applications and business insights into instant actions. Maximize uptime, optimize end-user experience, predict what comes next, and keep your business fearlessly moving forward.
-
SuperOpsSuperOps is a next-generation, all-in-one PSA-RMM platform designed for ambitious MSPs looking to scale efficiently. Infused with AI-driven intelligence and smart automation, SuperOps offers a comprehensive suite of features, from IT documentation to project management, ensuring MSPs have everything they need in one place. Say goodbye to juggling multiple disconnected tools—SuperOps empowers MSPs to move beyond outdated, fragmented systems with a cloud-native platform built for simplicity and productivity. Experience a seamless, modern solution that streamlines operations and makes managing IT services effortless.
-
NinjaOneNinjaOne automates the hardest parts of IT, empowering more than 20,000 IT teams. By providing deep insights into endpoints, robust security measures, and centralized control, NinjaOne boosts efficiency while safeguarding sensitive data and cutting IT expenses. This comprehensive platform offers a versatile toolkit for managing and securing endpoints, including patch management, mobile device oversight, software distribution, remote support, backup solutions, and more, thanks to its extensive IT and security integrations.
-
PulsewayPulseway, a remote monitoring and management software (RMM) for IT departments and MSPs, allows you to have complete control over your entire IT environment. Pulseway is easy to use and quick-to-deploy. It ensures that IT issues are identified, monitored, and resolved as soon as possible. The platform provides complete visibility through the Pulseway dashboard, advanced automation, remote management, OS & third party patch management, network monitoring and IT automation, custom reports as well as complete command traceability, email notification, and many other features. We also offer add-ons to endpoint protection, business management (PSA), backup & disaster restoration software, and integration with top AV providers to give your IT stack the power it deserves. Pulseway is used by over 6,000 customers around the world every day to manage their IT infrastructure. Get a 14-day free trial.
-
Device42Device42 is a robust and comprehensive data center and network management software designed by IT engineers to help them discover, document and manage Data Centers and overall IT. Device42 provides actionable insight into enterprise infrastructures. It clearly identifies hardware, software, services, and network interdependencies. It also features powerful visualizations and an easy-to-use user interface, webhooks and APIs. Device42 can help you plan for network changes and reduce MTTR in case of an unexpected outage. It provides everything you need for maintenance, audits and warranty, license certificate, warranty and lifecycle management, passwords/secrets and inventory, asset tracking and budgeting, building rooms and rack layouts... Device42 can integrate with your favorite IT management tools. This includes integration with SIEM, CM and ITSM; data mapping; and many more! As part of the Freshworks family, we are committed to, and you should expect us to provide even better solutions and continued support for our global customers and partners, just as we always have.
-
ManageEngine Log360Log360 is a SIEM or security analytics solution that helps you combat threats on premises, in the cloud, or in a hybrid environment. It also helps organizations adhere to compliance mandates such as PCI DSS, HIPAA, GDPR and more. You can customize the solution to cater to your unique use cases and protect your sensitive data. With Log360, you can monitor and audit activities that occur in your Active Directory, network devices, employee workstations, file servers, databases, Microsoft 365 environment, cloud services and more. Log360 correlates log data from different devices to detect complex attack patterns and advanced persistent threats. The solution also comes with a machine learning based behavioral analytics that detects user and entity behavior anomalies, and couples them with a risk score. The security analytics are presented in the form of more than 1000 pre-defined, actionable reports. Log forensics can be performed to get to the root cause of a security challenge. The built-in incident management system allows you to automate the remediation response with intelligent workflows and integrations with popular ticketing tools.
-
ConnectWise AutomateConnectWise Automate makes it easy to solve IT problems at lightning speed. ConnectWise Automate is a robust platform for remote monitoring and management (RMM). It helps IT teams increase their effectiveness. It allows teams to identify all devices and users that require proactive monitoring, remove delivery roadblocks and support more endpoints without adding to their workloads.
Description
Effectively addressing the intricate challenges posed by modern networks requires the implementation of advanced solutions in the realm of Network Observability. In this pursuit, consider embracing the cutting-edge offerings of Motadata AIOps, a leading provider in the industry. By integrating Motadata AIOps into your network infrastructure, you not only eliminate data silos but also gain unparalleled visibility into various facets such as network performance, SNMP data, Network Flow, and log data.
This comprehensive approach empowers you to monitor and analyze your network with utmost precision, ensuring seamless operations across diverse environments, from on-premise setups to the expansive landscape of cloud infrastructure. The synergy of innovative Network Observability and Motadata AIOps not only meets but exceeds the expectations set for network management, ushering in a new era of efficiency and reliability.
Description
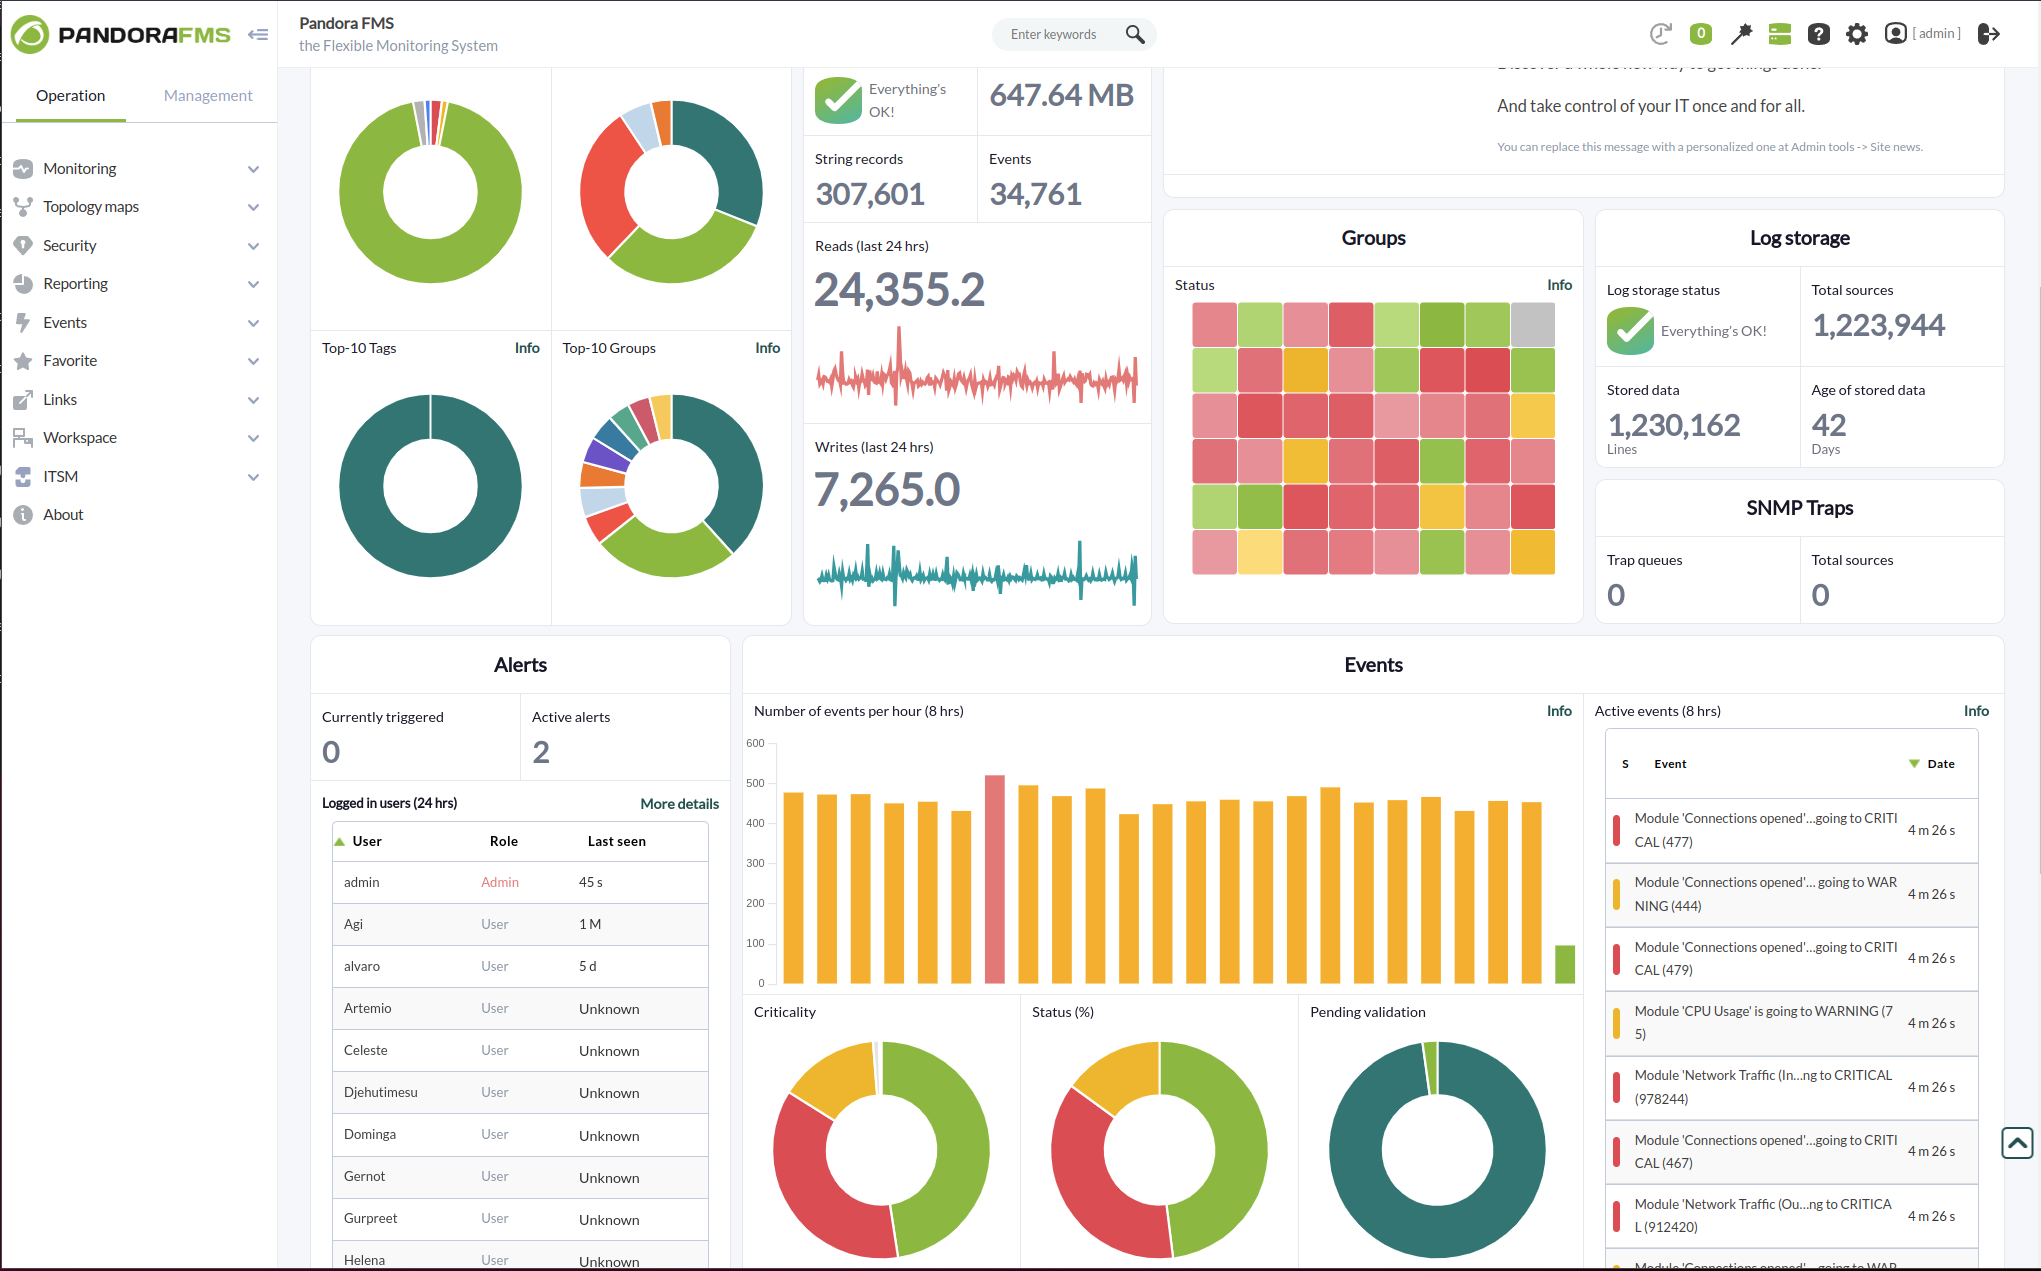
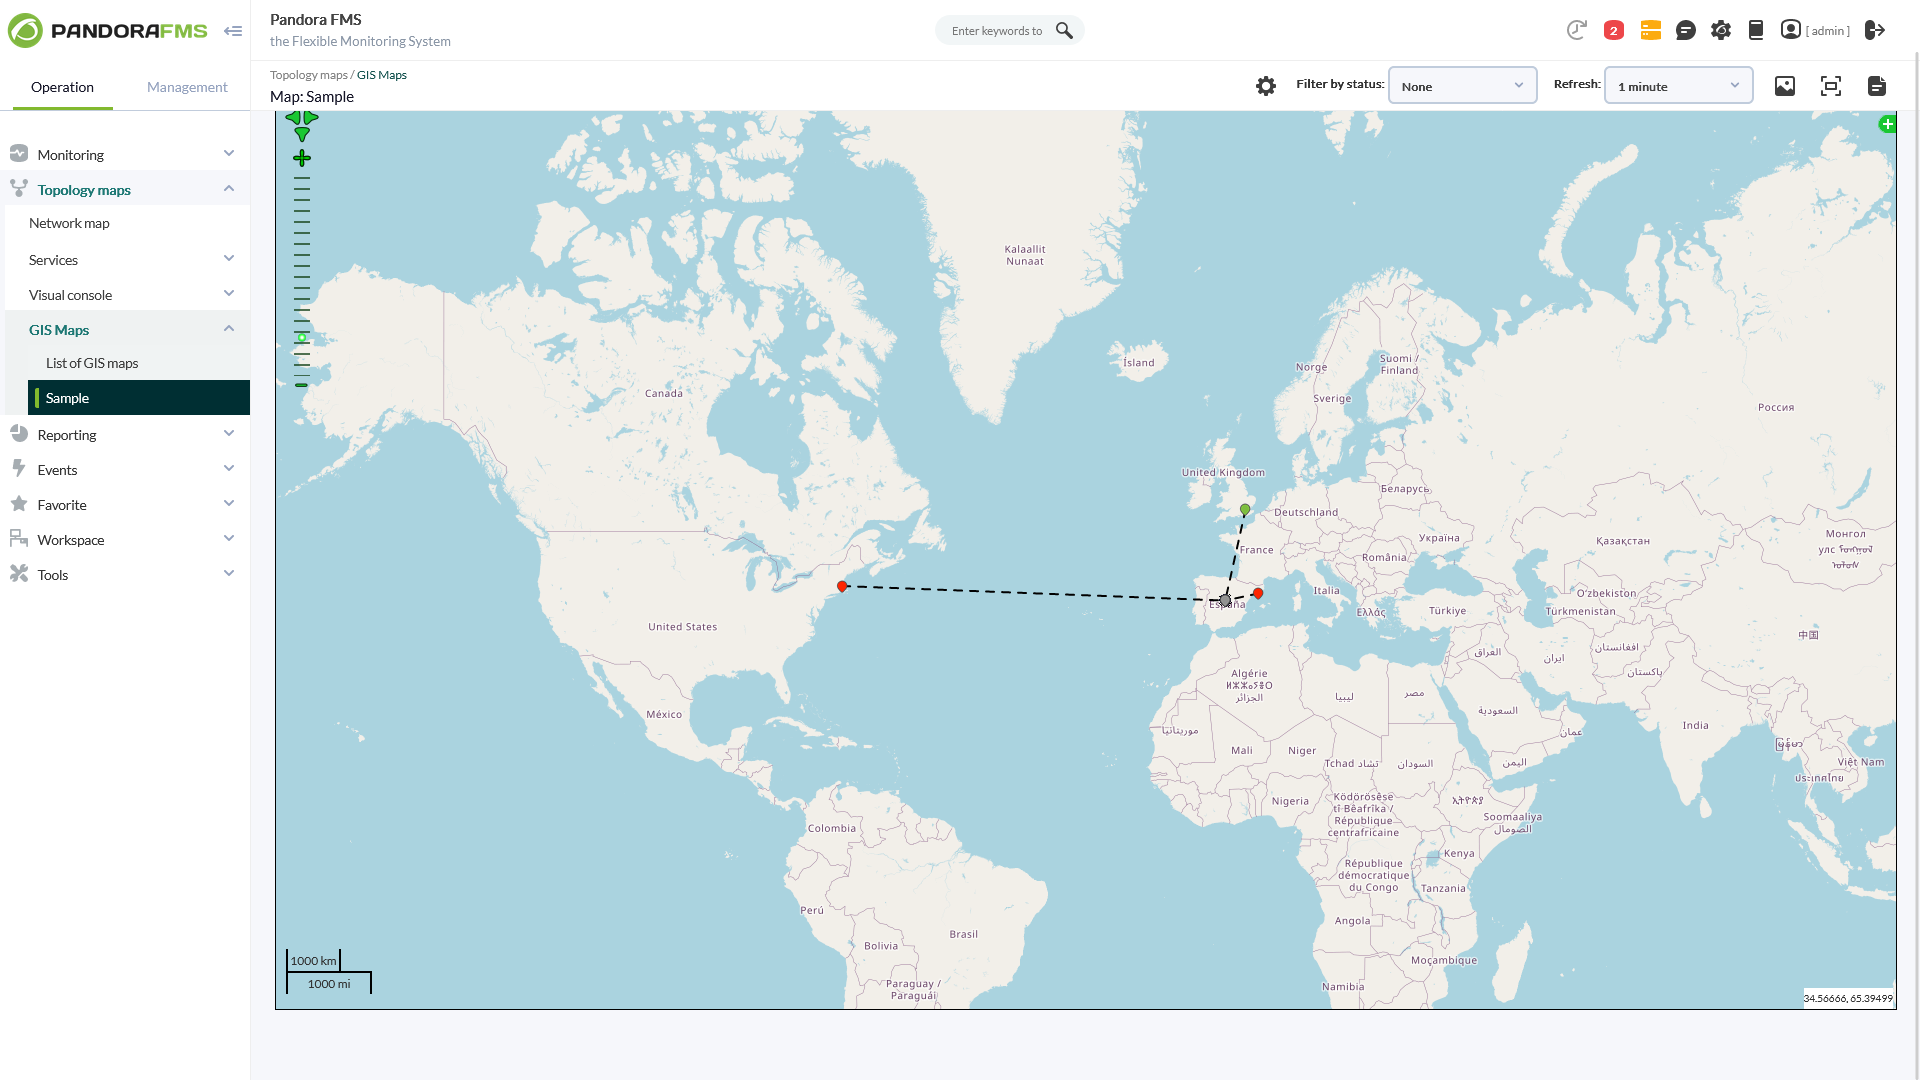
With more than 50,000 customer installations across the five continents, Pandora FMS is a truly all-in-one monitoring solution, covering all traditional silos for specific monitoring: servers, networks, applications, logs, synthetic/transactional, remote control, inventory, etc.
Pandora FMS allows you to quickly find and solve problems. It scales them so that they can be derived either from on-premise, multi-cloud, or both. You now have the ability to use your entire IT stack and analytics to solve any problem, even those that are difficult to find.
You can control and manage any technology and application with more than 500 plugins, including SAP, Oracle, Lotus or Citrix, Jboss, VMware, AWS and SQL Server.
API Access
Has API
API Access
Has API


Integrations
Android
Apache Kafka
Azure API Management
BlackBerry Notes
Cisco Nexus Dashboard Fabric Controller
Docker
Eclipse GlassFish
Grafana
HP-UX
JBoss EAP
Integrations
Android
Apache Kafka
Azure API Management
BlackBerry Notes
Cisco Nexus Dashboard Fabric Controller
Docker
Eclipse GlassFish
Grafana
HP-UX
JBoss EAP
Pricing Details
No price information available.
Free Trial
Free Version
Pricing Details
€90/month
Free Trial
Free Version
Deployment
Web-Based
On-Premises
iPhone App
iPad App
Android App
Windows
Mac
Linux
Chromebook
Deployment
Web-Based
On-Premises
iPhone App
iPad App
Android App
Windows
Mac
Linux
Chromebook
Customer Support
Business Hours
Live Rep (24/7)
Online Support
Customer Support
Business Hours
Live Rep (24/7)
Online Support
Types of Training
Training Docs
Webinars
Live Training (Online)
In Person
Types of Training
Training Docs
Webinars
Live Training (Online)
In Person
Vendor Details
Company Name
Motadata
Founded
2010
Country
India
Website
www.motadata.com
Vendor Details
Company Name
Pandora FMS
Founded
2005
Country
Spain
Website
pandorafms.com
Product Features
Help Desk
Alerts / Escalation
Automated Routing
Community Forums
Customizable Branding
Document Storage
Email Integration
IT Asset Management
Incident Management
Interaction Tracking
Knowledge Base
Known Issue Management
Live Chat
Multi-Channel Communication
Multiple Brands / Products
Network Monitoring
Real-time Chat
Self Service Portal
Service Level Agreement (SLA) Management
Ticket Management
IT Asset Management
Asset Tracking
Audit Management
Compliance Management
Configuration Management
Contract/License Management
Cost Tracking
Depreciation Management
IT Service Management
Inventory Management
Maintenance Management
Procurement Management
Requisition Management
Supplier Management
ITSM
Asset Tracking
Availability Management
Change Management
Configuration Management
Contract/License Management
Dashboard
Incident Management
Problem Management
Project Management
Release & Deployment Management
Self Service Portal
Log Management
Archiving
Audit Trails
Compliance Reporting
Consolidation
Data Visualization
Event Logs
Network Logs
Remediation
Syslogs
Thresholds
Web Logs
Network Monitoring
Bandwidth Monitoring
Baseline Manager
Diagnostic Tools
IP Address Monitoring
Internet Usage Monitoring
Real Time Analytics
Resource Management
SLA Monitoring
Server Monitoring
Uptime Monitoring
Web Traffic Reporting
Patch Management
Alerts/Notifications
Automatic Approval
Automatic Patch Deployment
Automatic Scans
Compliance Management
Custom Patches
Dashboard
Network Wide Management
Patch Prioritization
Patch Testing
Remote Access/Control
Vulnerability Scanning
Server Management
CPU Monitoring
Credential Management
Database Servers
Email Monitoring
Event Logs
History Tracking
Patch Management
Scheduling
User Activity Monitoring
Virtual Machine Monitoring
Service Desk
CMDB
Change Management
IT Asset Management
Incident Management
Knowledge Base
Mobile Access
Procurement Management
Remote Control
SLA Management
Self Service Portal
Product Features
Business Activity Monitoring
Alerts / Notifications
Business Process Management
Cross Application Analysis
Email Monitoring
Events Monitoring
KPI Monitoring
Pre-Configured Events
Reporting / Analytics
Workflow Management
Cloud Management
Access Control
Billing & Provisioning
Capacity Analytics
Cost Management
Demand Monitoring
Multi-Cloud Management
Performance Analytics
SLA Management
Supply Monitoring
Workflow Approval
Database Monitoring
Anomaly Detection
Autodiscovery
Capacity Planning
Dashboard
Dependency Tracking
Historical Trend Analysis
Multitenancy
Notifications / Alerts
Performance Monitoring
Permissions / Access Controls
Predictive Analytics
Prioritization
Query Analysis
Resource Optimization
Troubleshooting
IT Alerting
Alert Noise Reduction
Alert Routing
Dynamic Notifications
Enriched Incident Context
Escalation Policies
Incident History Audit
Multi-User Alerting
Multiple Alert Types
On-Call Management
Rich HTML Email Notifications
IT Infrastructure Monitoring
Alerts / Notifications
Application Monitoring
Bandwidth Monitoring
Capacity Planning
Configuration Change Management
Data Movement Monitoring
Health Monitoring
Multi-Platform Support
Performance Monitoring
Point-in-Time Visibility
Reporting / Analytics
Virtual Machine Monitoring
Network Mapping
Color Codes / Icons
Compliance Management
Device Auto Discovery
Hierarchical Mapping
Location-Based Mapping
Map Exporting
On-Demand Mapping
Reporting/Analytics
Self-Updating Maps
Web Traffic Reporting
Network Monitoring
Bandwidth Monitoring
Baseline Manager
Diagnostic Tools
IP Address Monitoring
Internet Usage Monitoring
Real Time Analytics
Resource Management
SLA Monitoring
Server Monitoring
Uptime Monitoring
Web Traffic Reporting
RMM
Deployment Management
For MSPs
IT Asset Management
Mobile Access
Network Monitoring
Patch Management
Real-time Alerts
Remediation Management
Server Management
CPU Monitoring
Credential Management
Database Servers
Email Monitoring
Event Logs
History Tracking
Patch Management
Scheduling
User Activity Monitoring
Virtual Machine Monitoring
System Monitoring
Alerts / Notifications
Antivirus Management
Data Backup / Recovery
Device Monitoring
Inventory Management
Patch Management
Policy-based Automation
Remote Monitoring
Reporting / Analytics
Risk Analysis
Server Monitoring
Service Configuration Management
Website Monitoring
Availability Testing
Event Logs
Event-Based Notifications
FTP Monitoring
Mail Server Monitoring
Maintenance Scheduling
Performance Metrics
Real Time Monitoring
Transaction Monitoring
Uptime Reporting