Average Ratings 0 Ratings
Average Ratings 27 Ratings
Similar Products
-
ManageEngine OpManagerOpManager is the ideal end-to-end network monitoring tool for your organization's network. With OpManager, you can keep a close eye on health, performance, and availability levels of all network devices. This includes monitoring switches, routers, LANs, WLCs, IP addresses and firewalls. Insights into your hardware health and performance; monitor CPU, memory, temperature, disk usage, and more to improve efficiency. Seamlessly manage faults and alerts with instant notifications and detailed logs. Streamlined workflows facilitate easy set-up to execute quick diagnosis and corrective measures. The solution also comes with powerful visualization tools such as business views, 3d data center views, topology maps, heat maps, and customizable dashboards. Get proactive in capacity planning and decision-making with over 250 predefined reports covering all important metrics and areas in your network. Overall, OpManager's detailed management capabilities make it the ideal solution for IT administrators to achieve network resiliency and efficiency.
-
AdRem NetCrunchNetCrunch is a next-gen, agentless infrastructure and traffic network monitoring system designed for hybrid, multi-site, and fast changing infrastructures. It combines real-time observability with alert automation and intelligent escalation to eliminate the overhead and limitations of legacy tools like PRTG or SolarWinds. NetCrunch supports agentless monitoring of thousands of nodes from a single server-covering physical devices, virtual machines, servers, traffic flows, cloud services (AWS, Azure, GCP), SNMP, syslogs, Windows Events, IoT, telemetry, and more. Unlike sensor-based tools, NetCrunch uses node-based licensing and policy-driven configuration to streamline monitoring, reduce costs, and eliminate sensor micromanagement. 670+ built-in monitoring packs apply instantly based on device type, ensuring consistency across the network. NetCrunch delivers real-time, dynamic maps and dashboards that update without manual refreshes, giving users immediate visibility into issues and performance. Its smart alerting engine features root cause correlation, suppression, predictive triggers, and over 40 response actions including scripts, API calls, notifications, and integrations with Jira, Teams, Slack, Amazon SNS, MQTT, PagerDuty, and more. Its powerful REST API makes NetCrunch perfect for flow automation, including integration with asset management, production/IoT/operations monitoring and other IT systems with ease. Whether replacing an aging platform or modernizing enterprise observability, NetCrunch offers full-stack coverage with unmatched flexibility. Fast to deploy, simple to manage, and built to scale-NetCrunch is the smarter, faster, and future-ready monitoring system. Designed for on-prem (including air-gapped), cloud self-hosted or hybrid networks.
-
Paessler PRTGPaessler PRTG is an all-inclusive monitoring solution with an intuitive, user-friendly interface powered by a cutting-edge monitoring engine. It optimizes connections and workloads, reduces operational costs, and prevents outages. It also saves time and controls service level agreements (SLAs). This solution includes specialized monitoring features such as flexible alerting, cluster failover, distributed monitoring, maps, dashboards, and in-depth reporting.
-
PathSolutions TotalViewTotalView offers network monitoring as well as root-cause troubleshooting of problems in plain-English. The solution monitors every device as well as every interface on every device. In addition, TotalView goes deep, collecting 19 error counters, performance, configuration, and connectedness so nothing is outside of it’s view. A built-in heuristics engine analyzes this information to produce plain-English answers to problems. Complex problems can now be solved by junior level engineers leaving the senior level engineers to work on more strategic level projects. The core product includes everything needed to run a perfectly healthy network: Configuration management, server monitoring, cloud service monitoring, IPAM, NetFlow, path mapping, and diagramming. Get Total Network Visibility on your network and solve more problems faster.
-
Site24x7Site24x7 provides unified cloud monitoring to support IT operations and DevOps within small and large organizations. The solution monitors real users' experiences on websites and apps from both desktop and mobile devices. DevOps teams can monitor and troubleshoot applications and servers, as well as network infrastructure, including private clouds and public clouds, with in-depth monitoring capabilities. Monitoring the end-user experience is done from more 100 locations around the globe and via various wireless carriers.
-
AuvikAuvik Network Management is a network management and monitoring software designed to empower IT professionals with deep visibility, automation, and control over their network infrastructure. This innovative platform is trusted by businesses of all sizes to streamline network operations, enhance security, and optimize performance. One of Auvik's standout features is its real-time network mapping and discovery capabilities. It automatically generates interactive, visual maps of your network topology, allowing you to easily identify devices, connections, and potential bottlenecks. This invaluable insight helps in planning and optimizing network architecture for maximum efficiency.
-
BlumiraEmpower Your Existing Team to Attain Enterprise-Level Security Introducing a comprehensive solution that combines SIEM, endpoint visibility, continuous monitoring, and automated responses to simplify processes, enhance visibility, and accelerate response times. We manage the burdens of security, allowing you to reclaim valuable time in your schedule. With ready-to-use detections, filtered alerts, and established response playbooks, IT departments can derive substantial security benefits through Blumira. Fast Setup, Instant Benefits: Seamlessly integrates with your technology ecosystem and is fully operational within hours, eliminating any waiting period. Unlimited Data Ingestion: Enjoy predictable pricing alongside limitless data logging for comprehensive lifecycle detection. Streamlined Compliance: Comes with one year of data retention, ready-made reports, and round-the-clock automated monitoring. Exceptional Support with a 99.7% Customer Satisfaction Rate: Benefit from dedicated Solution Architects for product assistance, a proactive Incident Detection and Response Team developing new detections, and continuous SecOps support around the clock. With this robust offering, your team can focus on strategic initiatives while we handle the intricacies of security management.
-
Cynet All-in-One Cybersecurity PlatformCynet equips MSPs and MSSPs with a fully managed, all-in-one cybersecurity platform that brings together essential security functions in a single, user-friendly solution. By consolidating these capabilities, Cynet simplifies cybersecurity management, reduces complexity, and lowers costs, eliminating the need for multiple vendors and integrations. With multi-layered breach protection, Cynet delivers robust security for endpoints, networks, and SaaS/Cloud environments, ensuring comprehensive defense against evolving threats. Its advanced automation enhances incident response, enabling swift detection, prevention, and resolution. Supported by a 24/7 Security Operations Center (SOC), Cynet’s CyOps team provides continuous monitoring and expert guidance to keep client environments secure. Partnering with Cynet allows you to deliver cutting-edge, proactive cybersecurity services while improving operational efficiency. See how Cynet can redefine your security offerings and empower your clients today.
-
UptrendsUptrends is all about cloud-based website performance that keeps track of performance, uptime, and functionality of your websites and APIs. The 24/7 monitoring service that proactively test your website and monitor multi-step transactions. Let’s face it—the Internet is a fragile thing. Stuff breaks or slows every now and then. Uptrends lets you know when it does and what exactly happened. Feel free to try Uptrends for 30 days with our free trial!
-
groundcoverCloud-based solution for observability that helps businesses manage and track workload and performance through a single dashboard. Monitor all the services you run on your cloud without compromising cost, granularity or scale. Groundcover is a cloud-native APM solution that makes observability easy so you can focus on creating world-class products. Groundcover's proprietary sensor unlocks unprecedented granularity for all your applications. This eliminates the need for costly changes in code and development cycles, ensuring monitoring continuity.
Description
In today's fast-moving business world, IT teams face immense pressure to ensure uninterrupted system availability while operating with limited resources. The IBM i server monitoring software streamlines this process by automating tasks that would typically require manual intervention, thus conserving both time and resources. With a straightforward download and easy implementation, deploying your solution across the organization becomes a hassle-free experience. After installation, users can take advantage of user-friendly features, automatic updates, and ready-to-use templates. You have the flexibility to select only the modules that suit your specific needs. Our tiered solutions cater to various levels, starting from basic monitoring to comprehensive operations management. As your organization expands, it allows for seamless addition of features to satisfy your evolving monitoring, automation, and reporting needs. Experience simplified oversight of multiple servers and applications through a convenient management interface that is accessible anytime and from anywhere, enhancing your operational efficiency further. This adaptability ensures that your IT infrastructure can grow harmoniously alongside your business objectives.
Description
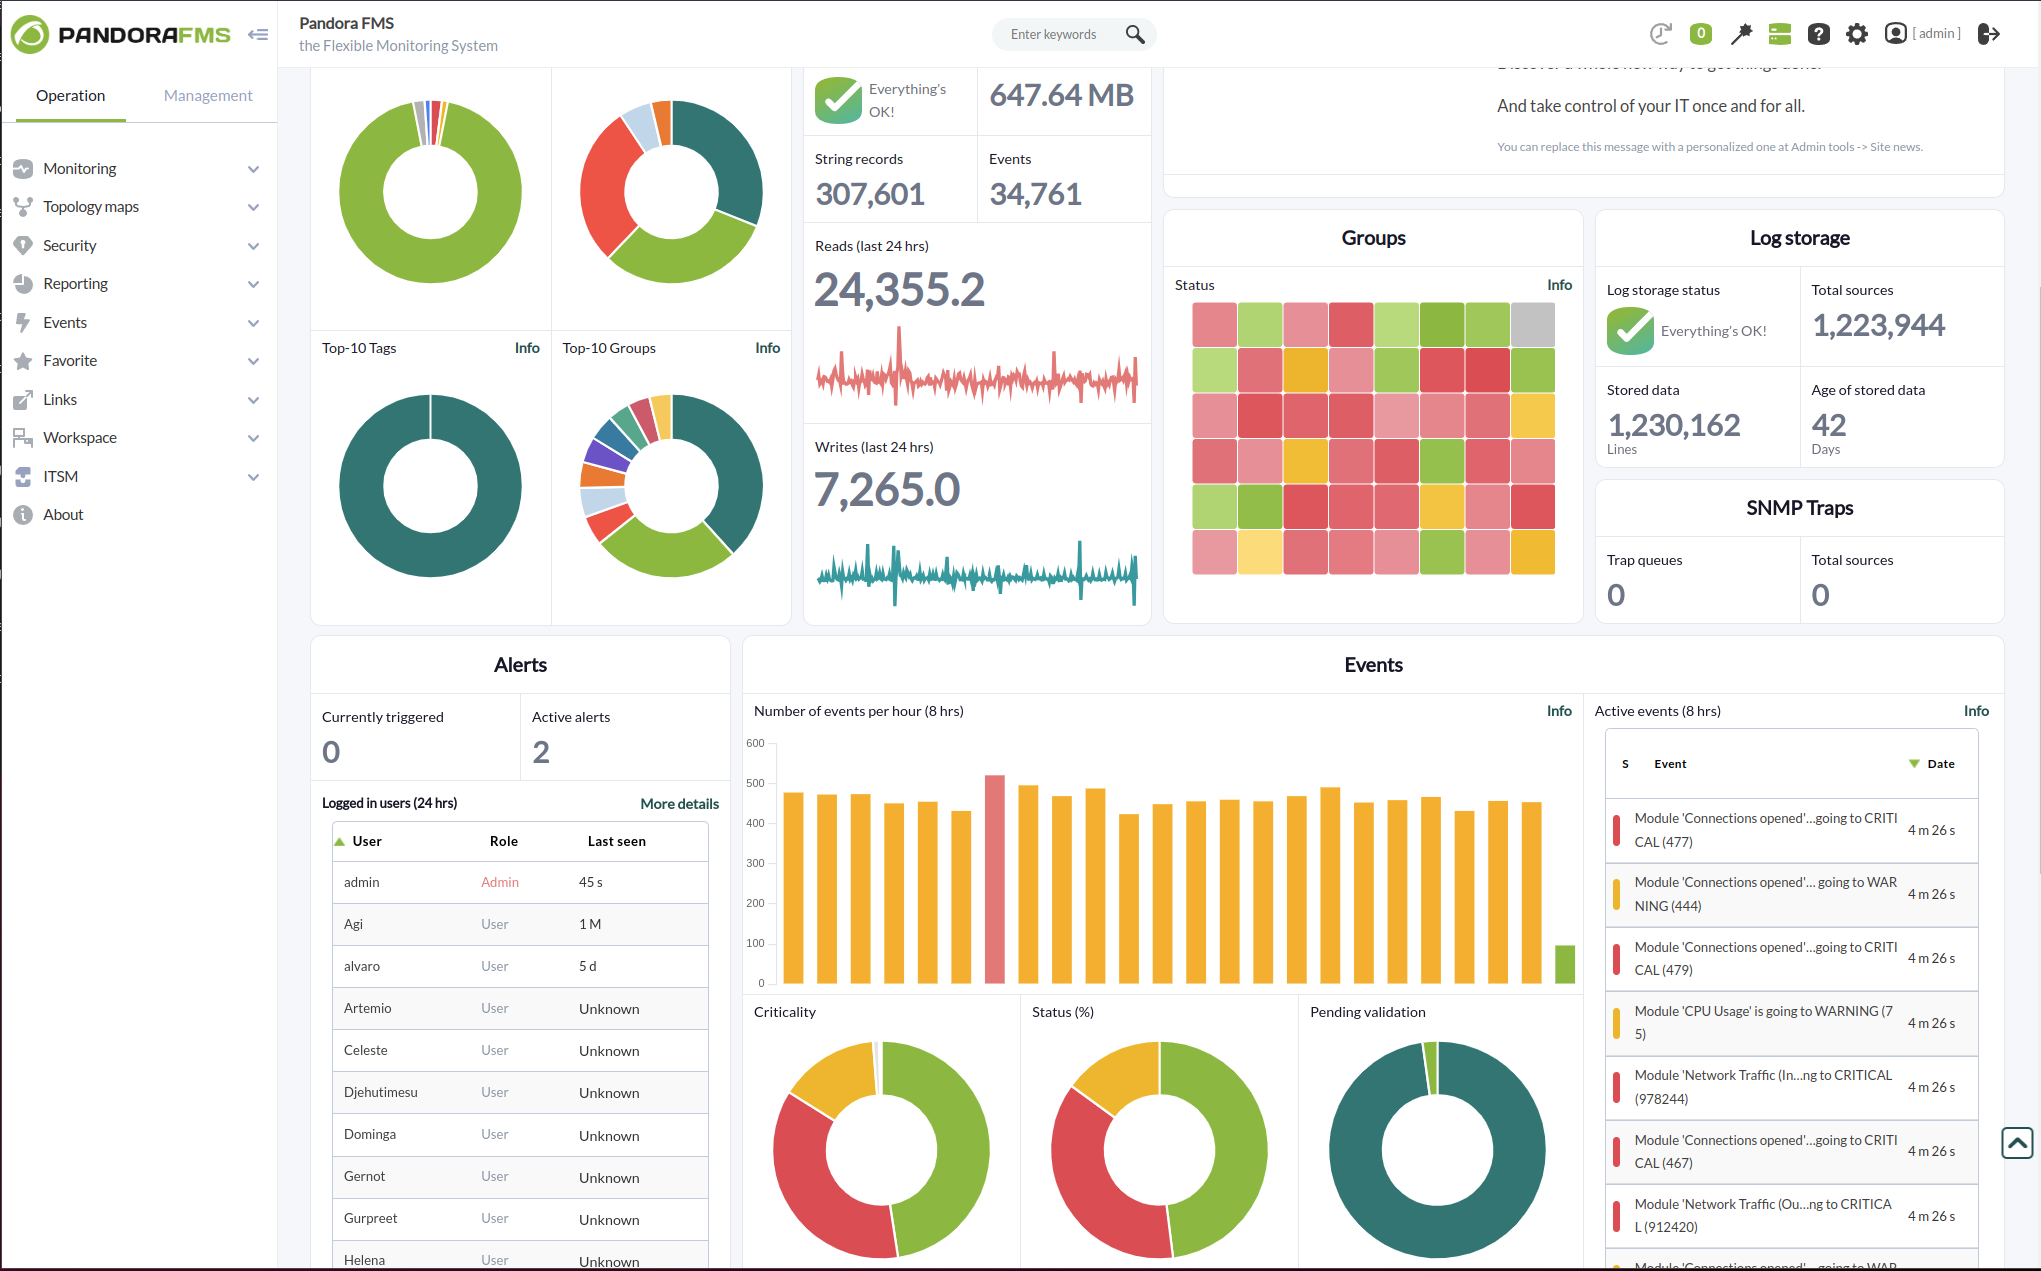
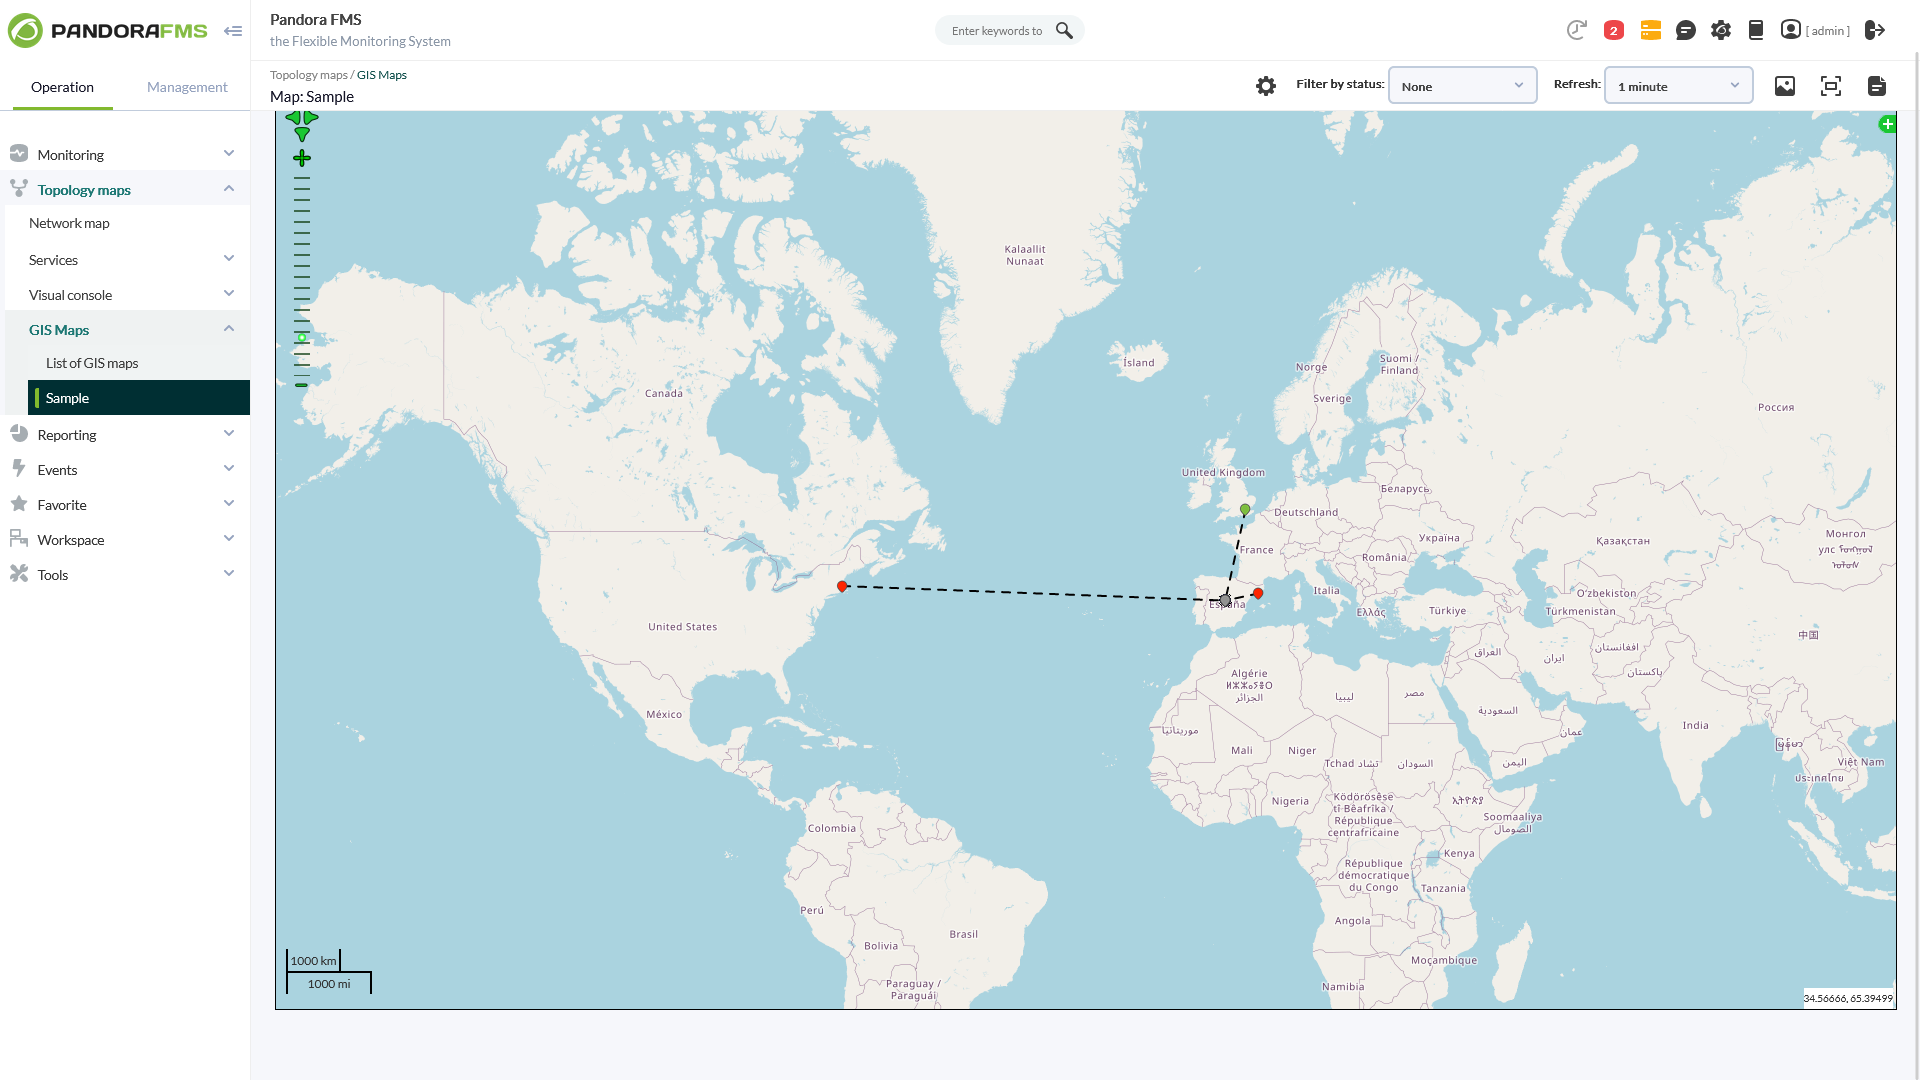
With more than 50,000 customer installations across the five continents, Pandora FMS is a truly all-in-one monitoring solution, covering all traditional silos for specific monitoring: servers, networks, applications, logs, synthetic/transactional, remote control, inventory, etc.
Pandora FMS allows you to quickly find and solve problems. It scales them so that they can be derived either from on-premise, multi-cloud, or both. You now have the ability to use your entire IT stack and analytics to solve any problem, even those that are difficult to find.
You can control and manage any technology and application with more than 500 plugins, including SAP, Oracle, Lotus or Citrix, Jboss, VMware, AWS and SQL Server.
API Access
Has API
API Access
Has API


Integrations
Active Directory
Amazon Web Services (AWS)
Apache Tomcat
Azure API Management
Azure Marketplace
BizTalk Server
Cisco Nexus Dashboard Fabric Controller
Eclipse GlassFish
Grafana
Hadoop
Integrations
Active Directory
Amazon Web Services (AWS)
Apache Tomcat
Azure API Management
Azure Marketplace
BizTalk Server
Cisco Nexus Dashboard Fabric Controller
Eclipse GlassFish
Grafana
Hadoop
Pricing Details
No price information available.
Free Trial
Free Version
Pricing Details
€90/month
Free Trial
Free Version
Deployment
Web-Based
On-Premises
iPhone App
iPad App
Android App
Windows
Mac
Linux
Chromebook
Deployment
Web-Based
On-Premises
iPhone App
iPad App
Android App
Windows
Mac
Linux
Chromebook
Customer Support
Business Hours
Live Rep (24/7)
Online Support
Customer Support
Business Hours
Live Rep (24/7)
Online Support
Types of Training
Training Docs
Webinars
Live Training (Online)
In Person
Types of Training
Training Docs
Webinars
Live Training (Online)
In Person
Vendor Details
Company Name
Fortra
Founded
1982
Country
United States
Website
www.fortra.com/products/system-monitoring-software-ibm-i-servers
Vendor Details
Company Name
Pandora FMS
Founded
2005
Country
Spain
Website
pandorafms.com
Product Features
Network Traffic Analysis (NTA)
Anomalous Behavior Detection
High Bandwidth Usage Monitoring
Historical Behavior Data
Identify High Network Traffic Sources
Network Transaction Visibility
Stream Data to IDR or Data Lake
Traffic Decryption
Product Features
Business Activity Monitoring
Alerts / Notifications
Business Process Management
Cross Application Analysis
Email Monitoring
Events Monitoring
KPI Monitoring
Pre-Configured Events
Reporting / Analytics
Workflow Management
Cloud Management
Access Control
Billing & Provisioning
Capacity Analytics
Cost Management
Demand Monitoring
Multi-Cloud Management
Performance Analytics
SLA Management
Supply Monitoring
Workflow Approval
Database Monitoring
Anomaly Detection
Autodiscovery
Capacity Planning
Dashboard
Dependency Tracking
Historical Trend Analysis
Multitenancy
Notifications / Alerts
Performance Monitoring
Permissions / Access Controls
Predictive Analytics
Prioritization
Query Analysis
Resource Optimization
Troubleshooting
IT Alerting
Alert Noise Reduction
Alert Routing
Dynamic Notifications
Enriched Incident Context
Escalation Policies
Incident History Audit
Multi-User Alerting
Multiple Alert Types
On-Call Management
Rich HTML Email Notifications
IT Infrastructure Monitoring
Alerts / Notifications
Application Monitoring
Bandwidth Monitoring
Capacity Planning
Configuration Change Management
Data Movement Monitoring
Health Monitoring
Multi-Platform Support
Performance Monitoring
Point-in-Time Visibility
Reporting / Analytics
Virtual Machine Monitoring
Network Mapping
Color Codes / Icons
Compliance Management
Device Auto Discovery
Hierarchical Mapping
Location-Based Mapping
Map Exporting
On-Demand Mapping
Reporting/Analytics
Self-Updating Maps
Web Traffic Reporting
Network Monitoring
Bandwidth Monitoring
Baseline Manager
Diagnostic Tools
IP Address Monitoring
Internet Usage Monitoring
Real Time Analytics
Resource Management
SLA Monitoring
Server Monitoring
Uptime Monitoring
Web Traffic Reporting
RMM
Deployment Management
For MSPs
IT Asset Management
Mobile Access
Network Monitoring
Patch Management
Real-time Alerts
Remediation Management
Server Management
CPU Monitoring
Credential Management
Database Servers
Email Monitoring
Event Logs
History Tracking
Patch Management
Scheduling
User Activity Monitoring
Virtual Machine Monitoring
System Monitoring
Alerts / Notifications
Antivirus Management
Data Backup / Recovery
Device Monitoring
Inventory Management
Patch Management
Policy-based Automation
Remote Monitoring
Reporting / Analytics
Risk Analysis
Server Monitoring
Service Configuration Management
Website Monitoring
Availability Testing
Event Logs
Event-Based Notifications
FTP Monitoring
Mail Server Monitoring
Maintenance Scheduling
Performance Metrics
Real Time Monitoring
Transaction Monitoring
Uptime Reporting