Average Ratings 0 Ratings
Average Ratings 0 Ratings
Similar Products
-
TIMiHigh-Performance Data Engineering. Total Sovereignty. TIMi delivers the power of a complete cloud data stack—on-premises, fully sovereign, and ridiculously fast. We reject artificial vendor lock-in and hidden costs. Instead, we offer absolute peace of mind through engineering excellence, giving your team the freedom to experiment, innovate, and solve complex AI, analytics, and automation challenges in record time. Why Top Enterprises Choose TIMi? Enterprise Integration & *No-Code* ETL/Data preparation: Automate complex workflows and seamlessly link your entire stack: SAP, Salesforce, SharePoint, S3, Azure Storage, PowerBI, Tableau, etc. Unmatched Infrastructure Efficiency: Our competitors such as Databricks, Dataiku, and MS Fabric all rely on Spark—and that makes them inherently inefficient since a single €2k TIMi server outperforms a 267-node Spark cluster. TIMi process billions of rows in seconds and manage petabyte-scale data lakes at a fraction of the cost. Proven AI Leadership: Harness pioneering machine learning from the creators of the first Auto-ML engine (est. 2007). Whether deployed on-premises or via our EU-Hosted Sovereign Cloud, TIMi empowers leaders in Banking, Telecoms, Manufacturing, Retail, Defense and Government.
-
GWIAnnually, we conduct surveys with over a million individuals worldwide, enabling businesses to swiftly grasp evolving consumer trends. Our user-friendly platform is tailored for busy teams, facilitating the extraction of essential information, customized analysis, and seamless sharing. Identify your ideal customer using more than 250,000 profiling metrics. Utilize question charts to gain insights into the thoughts, emotions, and actions of your audience. Aggregate data and visualizations to craft a compelling narrative for your team. Combine various data points for comprehensive analysis and deeper understanding. Access unparalleled insights into consumer behavior through survey results that capture the perspectives, interests, and actions of billions of individuals globally. We consistently pose the same survey questions across different regions, allowing for detailed insights into local markets while also providing a broader global perspective. Discover what consumers genuinely think about your brand and its competitors, gaining valuable insights into industry leaders and their market positions. This holistic approach ensures that businesses can navigate the complexities of consumer perception effectively.
-
TradingView Stock WidgetsAs fast as it takes to make a cup of coffee, grab powerful charts and add real-time financial information to your website. Simply copy and paste our iFrame codes, and you're good to go. Our display ratings make it easy to see the technical analysis of a symbol. This widget is ideal for macro-level analysis of the markets. This widget is especially useful on homepages. The widget displays the top five most active stocks, as well as the losing and winning stocks. It updates based upon current market activity so you always see the most relevant stocks. Keep an eye out for announcements and important economic events. You can also set up filters in just a few clicks. Our scrolling ticker tape allows you to go vintage Wall Street. This stock exchange-style ticker can be embedded in just a few clicks. You don't need a power suit or expensive watch.
-
HighchartsHighcharts, a Javascript-based charting library, makes it easy to add interactive charts and graphs to web or mobile projects of any size. Highcharts is used by more than 80% of the 100 biggest companies in the world, as well as thousands of developers from a variety of industries, including finance, publishing, application development, and data science. Highcharts is in active development since 2009. It remains a favorite among developers due to its robust feature set and ease-of-use documentation, accessibility features and vibrant community.
-
TrustInSoft AnalyzerTrustInSoft commercializes a source code analyzer called TrustInSoft Analyzer, which analyzes C and C++ code and mathematically guarantees the absence of defects, immunity of software components to the most common security flaws, and compliance with a specification. The technology is recognized by U.S. federal agency the National Institute of Standards and Technology (NIST), and was the first in the world to meet NIST’s SATE V Ockham Criteria for high quality software. The key differentiator for TrustInSoft Analyzer is its use of mathematical approaches called formal methods, which allow for an exhaustive analysis to find all the vulnerabilities or runtime errors and only raises true alarms. Companies who use TrustInSoft Analyzer reduce their verification costs by 4, efforts in bug detection by 40, and obtain an irrefutable proof that their software is safe and secure. The experts at TrustInSoft can also assist clients in training, support and additional services.
-
DXchartsIn just a few days, you can integrate and customize a lightning-fast financial table with your product. You can make changes or create a completely new interface. You want more? We offer a full access alternative. Data feeds with futures and indices, equities, FX and cryptocurrencies by default. Sign up now to get your data feeds. DXcharts can be integrated with any market data source, as it is data feed-agnostic. Native libraries for all platforms. Native web, native mobile & desktop. Get a solution that is specifically tailored to your product. Analyzing statistics from trading activity can help you evaluate securities and predict their future movements. You can create custom studies with the intuitive dxScript. You can adjust the layout of charts however you like and sync them by instrument, chart type and timeframe, range, studies & appearance.
-
Virtuoso QAVirtuoso QA is a secure, agentic test automation platform for any browser-based application. Touchstone, our agentic assurance layer, turns your business requirements into tests, then runs, fixes and maintains them as your application changes. More than thirty specialised agents author, generate, triage and self-heal your functional and end-to-end tests, while a deterministic engine executes every run and your team approves every decision that matters. Every release comes with evidence of what was tested, what changed and who approved it. Release Insights shows execution risk and requirement coverage across every journey, and teams can export an Evidence Report in minutes rather than assembling one over weeks. That makes the platform a natural fit for regulated industries like financial services, insurance, healthcare, the public sector and more. The mission is to set the standard of proof for software releases. AI generates software. Virtuoso QA generates the evidence to trust it.
-
SBS Quality Management SoftwareThe SBS QMS Suite consists of 5 software modules that work together for efficient Quality compliance: 1) SBS Quality Database - CAPA / 8D corrective and preventive actions (CAR) with root cause analysis - Nonconformance management - Risk analysis including FMEA, SWOT, interested party risk register - Internal, customer, and third-party audit management - Environmental Health and Safety (EHS / HSE) management 2) SBS Ground Control - Employee training management (LMS) - Self-Paced training - Change control - Document control 3) SBS Asset Tracking Database - Calibrated equipment control - Preventive maintenance - Asset inventory management 4) SBS Inspection Database - Record incoming material, in process, and final product inspection data - Generate real time SPC charts - Inspection plans and Control Plans - Archive data for further statistical analysis 5) SBS Vendor Management - Maintain an approved vendor list or AVL - Develop vendor / supplier qualification plans - Maintain vendor / supplier qualification history Modules may be purchased separately or in any combination. On-premise and cloud-based options are available. Free demos are available for download or contact us for a cloud-based demo.
-
Project InsightProject Insight helps organizations connect project data across teams and systems to make better decisions about their business. As a strategic project and portfolio management platform, it brings together resource and capacity planning, financial management, project requests, execution, governance, and portfolio performance. The result is a connected project data backbone that gives PMOs and executives visibility into organization-wide work and supports trustworthy reporting, forecasting, and AI analysis. Teams can continue using familiar tools such as Jira, Azure DevOps, Microsoft, Salesforce, ServiceNow, and HubSpot while Project Insight brings their project information into one central command center, reducing manual data entry and disconnected reporting. Manage projects, programs, and portfolios using flexible workflows, intelligent scheduling, Gantt charts, Kanban boards, time tracking, budget management, and customizable dashboards. Leaders can monitor workloads, project health, costs, and strategic priorities without chasing information across departments. AI-powered features help create project plans, turn meeting discussions into action items, recommend resources, forecast capacity, and evaluate what-if scenarios. From growing teams outgrowing spreadsheets to established PMOs with complex business processes, Project Insight adapts to the way organizations work through configurable processes, dedicated onboarding support, and free view-only access for clients and stakeholders.
-
BidtracerBidtracer was developed by two highly engineers, combining expertise in mechanical, electrical, and computer engineering. This innovative tool serves as a specialized sales operations and channel partner solution specifically designed for the commercial construction sector. The tool simplifies the process of initiating sale opportunities, creating bid tracking plans, and specs, while also inviting subcontractors for assistance. This allows users to swiftly utilize the estimate tool to draft and send out proposals to customers. It assists sales professionals in automating their follow-up process with bids, enabling them to track and determine the winning contractor. This ultimately maximizes their chance of successful closing sale projects. Efficient project management is crucial to optimize time and maximize profits in construction projects. By automating various project management tasks, we can streamline operations and simplify all aspects of the project’s operational side.
Description
ChartSays is an online statistical analysis platform designed for Six Sigma, quality engineering, and business analytics. It offers a variety of techniques for assessing process capability (including Cp, Cpk, Pp, and Ppk), creating control charts, conducting Gage R&R and measurement system analyses, designing experiments, performing regression, executing ANOVA, testing hypotheses, and analyzing reliability. Users have the ability to upload data in CSV, XLSX, TSV, or TXT formats to the comprehensive workspace where they can examine charts, review statistical outcomes, and obtain downloadable reports. Additionally, there are free calculators available for Cpk, I-MR control charts, and Gage R&R that do not require user registration. This tool is specifically tailored for quality engineers, Six Sigma experts, consultants, and analysts in both manufacturing and business sectors who seek effective statistical approaches for evaluating processes, enhancing quality, and conducting business analysis without the need for traditional desktop statistical software. Furthermore, ChartSays streamlines the analytical process, making it accessible for professionals who prioritize efficiency and ease of use.
Description
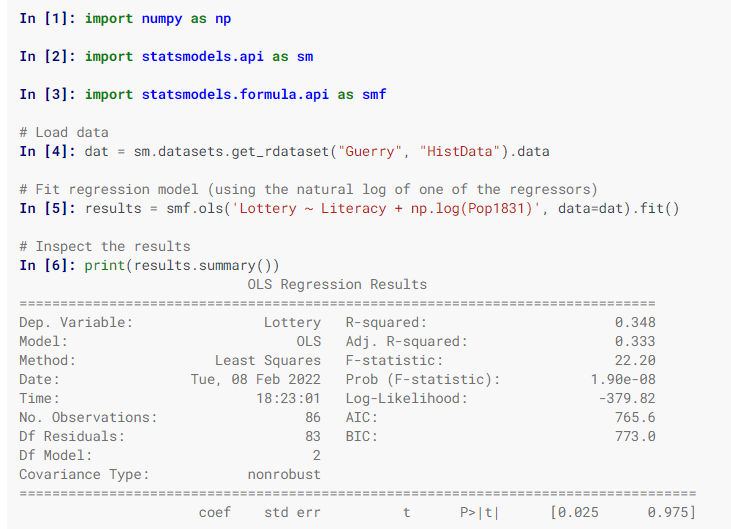
Statsmodels is a Python library designed for the estimation of various statistical models, enabling users to perform statistical tests and explore data effectively. Each estimator comes with a comprehensive array of result statistics, which are validated against established statistical software to ensure accuracy. This package is distributed under the open-source Modified BSD (3-clause) license, promoting free use and modification. Users can specify models using R-style formulas or utilize pandas DataFrames for convenience. To discover available results, you can check dir(results), and you will find that attributes are detailed in results.__doc__, while methods include their own docstrings for further guidance. Additionally, numpy arrays can be employed as an alternative to formulas. For most users, the simplest way to install statsmodels is through the Anaconda distribution, which caters to data analysis and scientific computing across various platforms. Overall, statsmodels serves as a powerful tool for statisticians and data analysts alike.
API Access
Has API
No
API Access
Has API
Yes
Screenshots View All
No images available

Integrations
Anaconda
No
Python
No
Pricing Details
$14.90/month
The free plan costs $0 and includes unlimited standard analyses and watermarked report exports; AI analysis and interpretation are not included. The monthly plan costs $14.90/month, and the annual plan costs $129/year. Paid plans include AI analysis and interpretation, remove watermarks from charts and new report exports, and include 300 AI uses per month. Subscriptions renew automatically; data is retained for up to 90 days.
Free Trial
No
Free Version
Yes
Pricing Details
Free
Free Trial
No
Free Version
Yes
Deployment
Web-Based
Yes
On-Premises
No
iPhone App
No
iPad App
No
Android App
No
Windows
No
Mac
No
Linux
No
Chromebook
No
Deployment
Web-Based
No
On-Premises
No
iPhone App
No
iPad App
No
Android App
No
Windows
Yes
Mac
Yes
Linux
Yes
Chromebook
No
Customer Support
Business Hours
No
Live Rep (24/7)
No
Online Support
Yes
Customer Support
Business Hours
No
Live Rep (24/7)
No
Online Support
Yes
Types of Training
Training Docs
Yes
Webinars
No
Live Training (Online)
No
In Person
No
Types of Training
Training Docs
Yes
Webinars
No
Live Training (Online)
No
In Person
No
Vendor Details
Company Name
Suzhou Jingye New Management Consulting Co., Ltd.
Founded
2026
Country
China
Website
chartsays.com
Vendor Details
Company Name
statsmodels
Website
www.statsmodels.org/stable/index.html
Product Features
Statistical Analysis
Analytics
No
Association Discovery
No
Compliance Tracking
No
File Management
No
File Storage
No
Forecasting
No
Multivariate Analysis
No
Regression Analysis
No
Statistical Process Control
No
Statistical Simulation
No
Survival Analysis
No
Time Series
No
Visualization
No
