Average Ratings 0 Ratings
Average Ratings 0 Ratings
Similar Products
-
DbVisualizerDbVisualizer is a universal database client for anyone who works with data, from indie developers and startups to professional teams managing complex database environments, including developers, DBAs, analysts, and data engineers working across relational and NoSQL databases. Key features: - SQL editor with intelligent autocomplete, visual query builders, variables, and execution tools - AI Assistant for answering questions, explaining errors, and analyzing code - Git integration for managing SQL scripts and team collaboration - Customizable layouts, key bindings, and UI themes - Favorites for frequently used scripts and database objects - Configurable security settings for organizational requirements Connects via JDBC to MySQL, PostgreSQL, SQL Server, Oracle, Snowflake, SQLite, Cassandra, BigQuery, and more. Runs on Windows, macOS, and Linux. Nearly 7 million downloads, with Pro users in 150 countries, scaling from solo projects to enterprise database management.
-
WEX Field Service ManagementWEX FSM is an innovative cloud-based platform designed to enhance every facet of a contractor's operations, encompassing everything from scheduling and dispatch to invoicing, payments, reporting, and customer management. By integrating various workflow tasks, it allows technicians, office personnel, and clients to function within a unified system that features real-time location tracking, intuitive drag-and-drop scheduling, optimized routing for dispatch, and comprehensive customer history, which includes job details, equipment data, notes, and photos. The platform also facilitates the creation of quotes and proposals, management of pricing books, and provides immediate mobile invoicing and payment solutions. With capabilities for supporting recurring service plans, offering flexible financing options, and incorporating integrated payment processing, WEX FSM accelerates cash flow by minimizing delays associated with invoicing and collections. Furthermore, it offers seamless connectivity to accounting software like QuickBooks, extensive reporting and analytics tools for valuable business insights, and a dedicated mobile application that empowers field technicians to efficiently manage their tasks and receive payments on-site. This combination of features ensures that contractors can operate more efficiently and effectively in a competitive market.
-
SurveyJSSurveyJS is a set of four open-source JavaScript libraries that offer the benefits of a tailor-made in-house survey application, while considerably reducing the time and resources needed to deploy the system. These libraries are independent of specific server code or database requirements and seamlessly integrate with popular JavaScript frameworks, including React, Angular, Vue.js, jQuery, Knockout, and more. They are designed to communicate with any server that can handle JSON requests, ensuring compatibility with various server architectures and databases. The product family is composed of: - An open-source MIT-licensed rendering library that renders dynamic JSON-based forms in your web application, and collects responses. - A self-hosted drag & drop form builder that features an integrated CSS-based theme editor and a GUI for conditional rules. It automatically generates JSON definitions (schemas) of your forms in real time. - PDF Generator, a library that renders SurveyJS surveys and forms as PDF files in a browser; - The Dashboard library that allows you to simplify survey data analysis with interactive and customizable charts and tables. Visit our website to try out and evaluate our full-scale demo for free.
-
Resco Field Service+Resco Field Service+ empowers field service teams by transforming traditional service processes into streamlined digital workflows. Built to enhance operations in industries like utilities, telecommunications, manufacturing, and energy, Field Service+ combines offline functionality with advanced scheduling, routing, and data capture tools to keep teams productive in any environment. With seamless integration into Dynamics 365 and Salesforce, Resco Field Service+ enables real-time data access and updates from the field, reducing manual entry and eliminating paper-based records. Field technicians can use their mobile devices to capture photos, scan barcodes, complete checklists, and access service history—even offline, which is critical for remote or high-traffic areas. Features include drag-and-drop customization, allowing teams to create workflows, forms, and reports without coding. Its GPS and routing capabilities help technicians optimize their routes, and with real-time insights, supervisors can monitor job status and resource allocation on the go. Resco Field Service+ makes managing field operations efficient and reliable, helping organizations improve response times, reduce errors, and enhance customer satisfaction.
-
ActiveBatch Workload AutomationActiveBatch by Redwood is a centralized workload automation platform, that seamlessly connects and automates processes across critical systems like Informatica, SAP, Oracle, Microsoft and more. Use ActiveBatch's low-code Super REST API adapter, intuitive drag-and-drop workflow designer, over 100 pre-built job steps and connectors, available for on-premises, cloud or hybrid environments. Effortlessly manage your processes and maintain visibility with real-time monitoring and customizable alerts via emails or SMS to ensure SLAs are achieved. Experience unparalleled scalability with Managed Smart Queues, optimizing resources for high-volume workloads and reducing end-to-end process times. ActiveBatch holds ISO 27001 and SOC 2, Type II certifications, encrypted connections, and undergoes regular third-party tests. Benefit from continuous updates and unwavering support from our dedicated Customer Success team, providing 24x7 assistance and on-demand training to ensure your success.
-
D&B Risk AnalyticsGlobally, teams in risk, procurement, and compliance are under pressure to manage geopolitical risks and business risks. Third-party risks are impacted by the complexity of domestic and international businesses, as well as complex and diverse regulations. It is crucial that companies proactively manage third-party relationships. This cutting-edge platform, powered by D&B Data Cloud's 520M+ Global Business Records with 2B+ annual updates for third-party risks, is an AI-powered solution that mitigates and monitors counterparty risk on a continual basis. D&B Risk Analytics uses best-in class risk data, including alerts for high-risk purchases and match points of more than a billion. This helps to drive informed decisions. Intelligent workflows allow for quick and thorough screening. Receive alerts on key business indicators.
-
JotformTrusted by over 25 million users worldwide, Jotform is an all-in-one platform that simplifies data collection, workflow automation, and online sales, all without coding. With Jotform’s drag-and-drop Form Builder, businesses can create customized forms and surveys to collect leads, contact information, payments, appointments, and e-signatures with ease. Choose from over 10,000 templates for everything from feedback surveys to registration forms, or build your own from scratch. Jotform's advanced features, such as conditional logic, autoresponders, and over 200 integrations, further streamline processes. In addition, Jotform's AI-powered Agents offer real-time customer support by guiding users through the form submission process, answering questions, and ensuring a smooth experience, all while reducing the need for manual intervention. With Jotform’s Store Builder, you can also set up an online store, sell products, services, and subscriptions, collect donations, and receive payments through 30+ supported payment gateways. Finally, Jotform’s tools like Approvals, PDF Editor, and Report Builder help businesses transform collected data into actionable insights and automate workflows for even greater efficiency.
-
IntellimasIntellimas is a no code/low code software platform with a spreadsheet and form UI. Intellimas allows you to build web apps that can completely align with your business process. Intellimas is built for fast data entry, analytics, exception management, and easy retrieval of live data from other systems. The grid UI allows for an easy transition from spreadsheets. This comprehensive view, along with our form view, provide you with the flexibility to handle unlimited use cases. Intellimas can be deployed on premise or on our cloud platform. Customers typically find many uses for Intellimas after the first rollout. Intellimas comes with configurable dashboards and a full reporting tool so the intelligence is at your fingertips. Revision history, configurable alerts, comprehensive workflow, and much more is available in the configuration engine for building out apps. Bring your simple and complex use cases and build them in Intellimas. It is a top software to replace your mega-spreadsheets and fill enterprise system gaps. Contact us for a demo and ask us about our free trial!
-
Planview ProjectAdvantagePlanview ProjectAdvantage brings clarity, control, and scalability to enterprise project management by unifying project data, resources, and performance insights in one platform. Built for growing PMOs and complex organizations, it eliminates silos and inefficiencies by connecting teams through a single source of truth. Users can monitor resource allocation, track workloads, and forecast capacity with precision using dynamic dashboards. ProjectAdvantage’s portfolio scoring tools and sandbox environments make it easy to prioritize initiatives and align them with company strategy. Its flexibility supports any methodology—Agile, hybrid, or Waterfall—making it ideal for diverse industries and workflows. Seamless integrations with leading enterprise systems like Jira, ServiceNow, and Microsoft Teams enable cross-functional collaboration and real-time visibility. Backed by AI-driven analytics, Planview Projectadvantage helps accelerate project delivery, improve performance tracking, and ensure continuous strategic alignment. Designed for agility, it’s a transformative solution that turns project chaos into structured, measurable success.
-
DXchartsIn just a few days, you can integrate and customize a lightning-fast financial table with your product. You can make changes or create a completely new interface. You want more? We offer a full access alternative. Data feeds with futures and indices, equities, FX and cryptocurrencies by default. Sign up now to get your data feeds. DXcharts can be integrated with any market data source, as it is data feed-agnostic. Native libraries for all platforms. Native web, native mobile & desktop. Get a solution that is specifically tailored to your product. Analyzing statistics from trading activity can help you evaluate securities and predict their future movements. You can create custom studies with the intuitive dxScript. You can adjust the layout of charts however you like and sync them by instrument, chart type and timeframe, range, studies & appearance.
Description
Quick BI brings advanced analytic functions that were previously available only to professional analysts, enabling users to conduct data analysis, exploration, and reporting on large datasets through intuitive drag-and-drop functionality and a diverse array of visualizations. This tool not only allows for comprehensive data analytics and exploration but also empowers enterprise users to analyze information effectively, facilitating informed, data-driven decision-making processes. It supports a variety of data sources, including ApsaraDB for RDS, AnalyticDB, MaxCompute, MySQL, SQL Server, and local files, ensuring versatility in data handling. With its user-friendly drag-and-drop interface, robust data modeling capabilities, and effective data visualization tools, you can quickly create and customize data portals. Additionally, Quick BI dashboards can be seamlessly integrated into third-party systems for direct access to reports and charts. Furthermore, it offers the ability to set specific access permissions for individual rows, allowing different user roles to view customized versions of the same report, enhancing data security and relevance. This flexibility in access control helps organizations tailor their data insights to meet the specific needs of various stakeholders.
Description
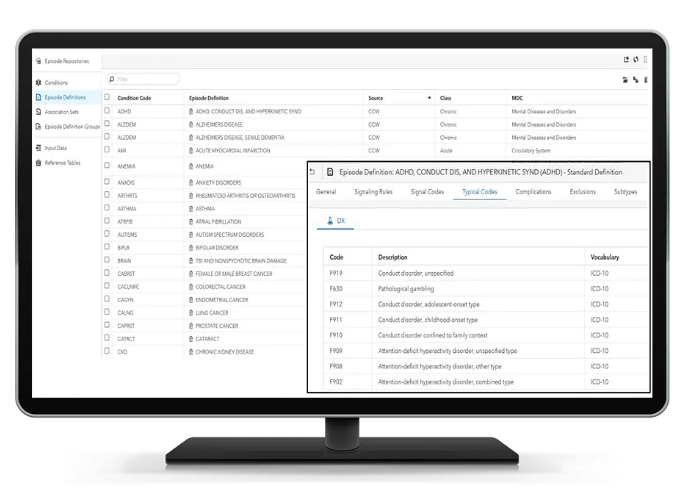
Enhance your digital transformation journey while uncovering valuable insights from your data with customized health analytic solutions. Featuring an intuitive drag-and-drop interface, SAS Health Cohort Builder allows users to query and create cohorts based on temporal relationships without any coding skills necessary. This user-friendly tool enables easy exploration of cohort traits and the impact of various inclusion or exclusion criteria on patient groups, assisting in assessing the feasibility of studies. You have the capability to save cohort definitions for future use, modify them as needed, and apply them across different real-world data resources for comparative analysis, ultimately conserving both time and resources. Additionally, you can validate findings and conduct further analyses through in-memory processing and visualization in SAS or other platforms such as R, Python, and various third-party visualization applications. On the other hand, SAS Health: Episode Builder empowers you with the ability to view and modify episode definitions directly, ensuring that you have control over the process. With SAS’s fully documented logic to generate episodes of care, you can rest assured that the underlying business rules are both transparent and subject to audit at any time, further enhancing the reliability of your health data analytics. This combination of features positions SAS as a leading tool in the realm of health analytics.
API Access
Has API
API Access
Has API


Integrations
Alibaba Cloud
Amazon RDS
MaxCompute
MySQL
PostgreSQL
Python
SQL Server
Integrations
Alibaba Cloud
Amazon RDS
MaxCompute
MySQL
PostgreSQL
Python
SQL Server
Pricing Details
No price information available.
Free Trial
Free Version
Pricing Details
No price information available.
Free Trial
Free Version
Deployment
Web-Based
On-Premises
iPhone App
iPad App
Android App
Windows
Mac
Linux
Chromebook
Deployment
Web-Based
On-Premises
iPhone App
iPad App
Android App
Windows
Mac
Linux
Chromebook
Customer Support
Business Hours
Live Rep (24/7)
Online Support
Customer Support
Business Hours
Live Rep (24/7)
Online Support
Types of Training
Training Docs
Webinars
Live Training (Online)
In Person
Types of Training
Training Docs
Webinars
Live Training (Online)
In Person
Vendor Details
Company Name
Alibaba Cloud
Founded
2008
Country
China
Website
www.alibabacloud.com/es/product/quickbi
Vendor Details
Company Name
SAS
Country
United States
Website
www.sas.com/en_us/software/health.html
Product Features
Business Intelligence
Ad Hoc Reports
Benchmarking
Budgeting & Forecasting
Dashboard
Data Analysis
Key Performance Indicators
Natural Language Generation (NLG)
Performance Metrics
Predictive Analytics
Profitability Analysis
Strategic Planning
Trend / Problem Indicators
Visual Analytics
