they predicted that Antarctic sea ice would increase in a warming world
But they DIDN'T predict growing sea ice in a world that is NOT warming, did they? [Jane Q. Public, 2015-05-22]
Good grief, Jane. They also didn't predict growing sea ice in a world that's infested with leprechauns. But neither of those silly objections are relevant, because the real world is warming. Remember?
"We know the Earth is warming, you idiot. That's not the issue here." [Lonny Eachus, 2010-07-01]
Since these conditions are not the conditions presumed in the model, in fact they have not predicted anything. You are just a master at inappropriately shifting contexts, as I have pointed out many time. You don't get to say that they predicted a result given THESE conditions, then say the same result under OTHER conditions constitutes a "prediction". Especially given the uncertainties involved. That's bullshit. [Jane Q. Public, 2015-05-22]
Nonsense, Jane. Manabe et al. 1991 predicted that increasing atmospheric CO2 warms the planet and causes a slight increase in Antarctic sea ice. This certainly constitutes a prediction because these conditions are happening. After all, as you've said, nobody is denying it's warming.
The next time you want to keep ignoring the predictions of Manabe et al. 1991 and all these other confirmed predictions, it might be more honest to just say that you reject all those confirmed predictions, rather than trying to pretend that they never happened.
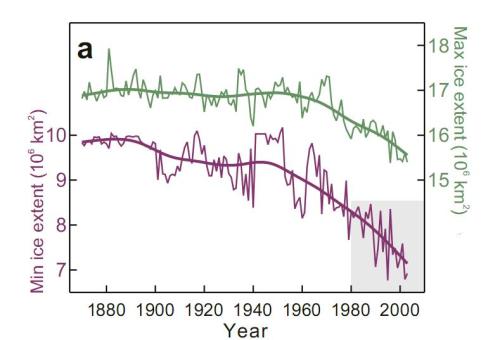
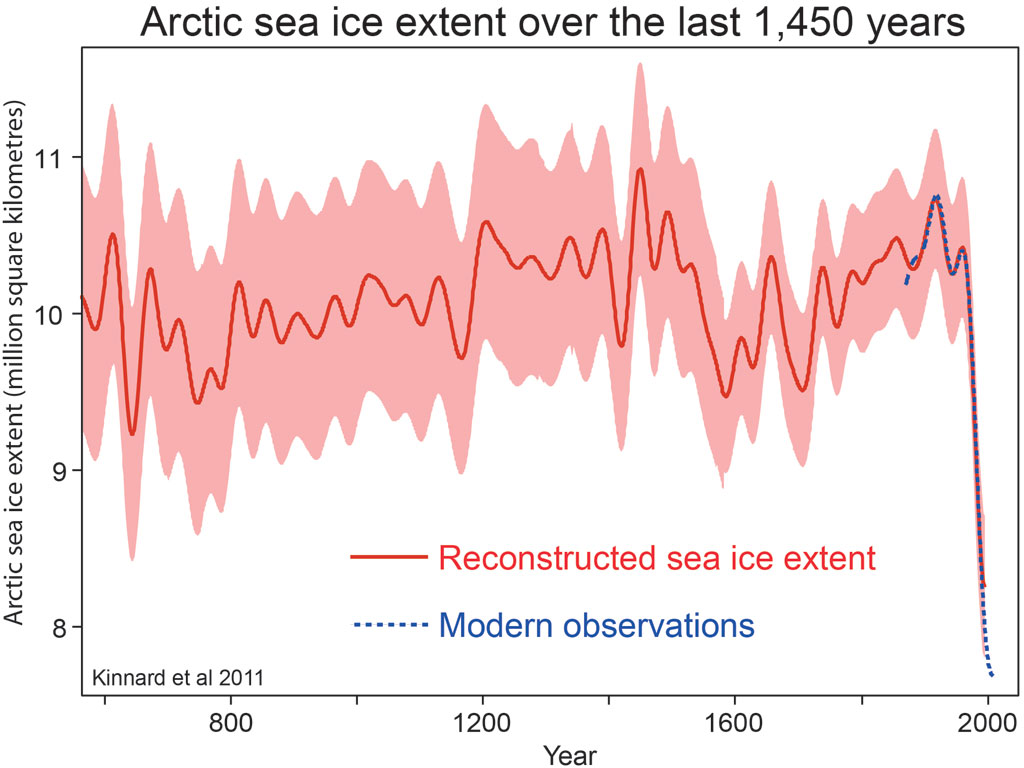
That's absurd, Jane. I've repeatedly linked to Polyak et al. 2010 and Kinnard et al. 2011. Polyak et al. reconstructs Arctic sea ice back to 1870, and Kinnard et al. goes back 1,450 years.
... I will ask you again: would the slope be the same if you chose 2000 for a starting point, or 1850? No, it would not. I made a simple comment based on a simple fact: 1981 was at or near a local maximum, and using it for a starting point of your "average" is questionable at best. That is an accurate statement. If you chose 1930 instead, as another local maximum you would again have to justify that as a starting point. You don't get to weasel out of that. [Jane Q. Public, 2015-05-22]
I don't have to "weasel out" of anything, because despite your baseless accusation I've always advocated using all the available data. In the context of using a single dataset, that means not cherry-picking the starting point, and instead using the entire dataset.
That's why it was so baffling when Jane baselessly accused Layzej of cherry-picking when he loaded the entire UAH dataset, then Jane suggested only using data since 1998. Jane was the only person in that conversation who suggested cherry-picking a starting point, rather than simply loading all the data in the dataset. Then Jane did it again.
And now Jane keeps asking what starting point I would use. Again, I wouldn't cherry-pick a starting point. I'd load the entire dataset into the trend analysis code I've already shared with Jane. Here's that example. The black line on the second page shows the UAH trend ending in 2012, for different starting years. The error bars are shown in red; they're 95% confidence uncertainty bounds.
Note that my analysis uses the entire dataset, and allows one to immediately see the calculated trends and uncertainties for many starting points at once, going all the way back to the first value in the dataset.
If you'd like, I could modify that code to load Arctic sea ice extent data, then share the new code and results with you. Or maybe you'd like to show off your programming skills instead? Either way, just let me know what dataset you'd like to investigate and we could actually start analyzing that entire dataset, with no cherry-picking of starting points at all.
But I doubt we'd find much support for Jane's claim, because neither this graph of the NSIDC Arctic sea ice index or Polyak et al.'s Fig. 2(a) show a clear local maximum in 1981 or 1979, either for the minimum or maximum sea ice extent.
... I will ask you again: would the slope be the same if you chose 2000 for a starting point, or 1850? No, it would not. I made a simple comment based on a simple fact: 1981 was at or near a local maximum, and using it for a starting point of your "average" is questionable at best. That is an accurate statement. If you chose 1930 instead, as another local maximum you would again have to justify that as a starting point. You don't get to weasel out of that. [Jane Q. Public, 2015-05-22]
Jane introduced "1981" here which seems to be a reference to this NSIDC Arctic sea ice extent plot. Once again, Jane hasn't actually presented any evidence that 1981 was at or near a local maximum. But let's humor Jane and pretend that 1981 was a really huge local maximum for Arctic sea ice extent. NSIDC calculated the average Arctic sea ice extent from 1981-2010. As Jane asks, would the slope be the same if the NSIDC chose 2000 for a starting point for their average? (*)
If the NSIDC chose to use a 2000-2010 average, that wouldn't change the calculated trends/slopes like these on page 2 here. That's because the NSIDC isn't cherry-picking data starting points when they use a 1981-2010 average. They're still using all the data, but just comparing that data to an average over 30 years.
Sadly, many people seem to be confused about calculating an average and using it as a baseline.
That's why I've said that confusion regarding baselines makes me think that plotting the trends and error bars is better than plotting the timeseries with an "ideal" baseline. Since the trend is the time derivative of the original timeseries, the constant baseline is irrelevant.
Another way of appreciating this point would be to notice that absolutely nothing would change on this NSIDC Arctic sea ice extent plot if that hypothetical really huge local maximum happened in 2010 rather than 1981. Again, that's because the NSIDC isn't cherry-picking data starting points when they use a 1981-2010 average. They're just calculating an average, so whether the maximum occurs in 1981 or 2010 is irrelevant.
Once you realize that the NSIDC is just calculating an average, it should be clear that the most important criterion is how long a timespan that average covers. That way, a hypothetical really huge local maximum gets averaged together with other years. I've said that I like plots with 30 year baselines because that's long enough to define the climate. Since that NSIDC plot uses a 30 year long baseline, it seems okay to me.
Jane, can we agree that a 30 year baseline is better than a 10 year baseline (like 2000-2010) or even a ~1 year baseline because longer baselines average out more weather noise? Can we agree that any choice of baseline is irrelevant to calculating trends/slopes like these on page 2 here?
(*) Obviously the NSIDC couldn't choose a starting point of 1850 on their satellite data plot because the modern satellites were launched in ~1979, but it seems unlikely that Jane will ever concede that he was wrong to insist that "your precious warmism sources consistently start THEIR charts in 1979, and if that isn't cherry-picking, nothing is."
Once again, this is completely backwards. In the context of using a single dataset, loading that entire dataset isn't cherry-picking. Arbitrarily cherry-picking a starting point of 1998 is cherry-picking. This isn't complicated, Jane.
If you should ever start actually using "all the available data", and were honest with yourself, I think you might start softening your tone. [Jane Q. Public, 2015-05-22]
Once again, Jane's concern about my tone is incredibly ironic. And Jane, keep in mind that you were cussing and insulting me while defending your Latour nonsense... which you finally admitted violates "kindergarten-level physics".
But you obviously can't admit your "silly gradeschool-level" mistake, even after defending it while calling me a goddamned stupid dumbshit despicable human being fraudulent dishonest lying fucking moron idiot asshole malicious lying sonofabitch.
After all that, don't you see even the tiniest bit of irony when you criticize my tone and repeatedly claim to be happy to admit your mistakes?
