Please create an account to participate in the Slashdot moderation system


Forgot your password?
typodupeerror
×

Comment Re:Too weak because humans are not the cause (Score 1) 145

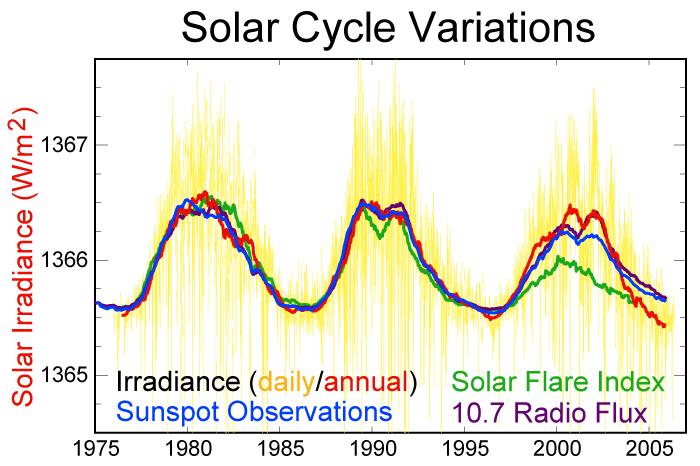
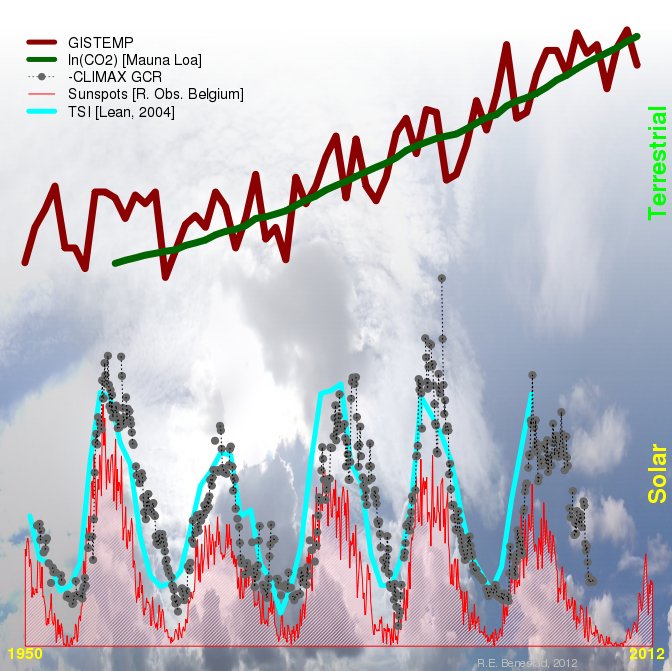
I think all the solar activity graphs look like that, they are based on the same satellite data. For example:

http://upload.wikimedia.org/wikipedia/commons/0/0d/Solar-cycle-data.png

How can increased solar activity be causing global warming if solar activity is not increasing? Isn't it more likely that the huge increase in CO2, a strongly-warming gas, is the cause?

Comment Re:Too weak because humans are not the cause (Score 1) 145

It is warmer now than it's ever been in modern times, according to the people who try to measure global temperature. Here's the NOAA global temperature since 1880:

http://www.ncdc.noaa.gov/sotc/service/global/glob/201410.gif

I realise that it's horribly cold in a lot of the US at the moment, but globally the world is very warm.

Comment Re:Too weak because humans are not the cause (Score 1) 145

Are you sure? Here's the usual solar activity / climate graph and there's no clear correlation between the Sun's activity and temperature, but a very obvious link to CO2.

The article you link shows how cosmic rays can seed cloud formation, which may well be correct, but I don't think there's any evidence of the next step, increased temperature.

Comment Re:Lucky sods (Score 1) 334

That's only the figure for the national road network, ie. motorways and some A roads (but not all, I think?). Local authorities spend bucketloads of money maintaining minor roads, more than enough to wipe out the direct taxes motorists pay.

Or that was all true last time I looked into it, perhaps things have shifted since.

Comment Re:Lucky sods (Score 1) 334

The UK road system is subsidised by general taxation, ie. gas tax + road tax + VED + VAT on vehicles sales < cost of UK road network.

It depends a bit what you count as the road network: just the national highway system, or highways plus major roads, do you include roads paid for by local authorities etc. etc.

Comment Re:What difference will it make? (Score 5, Informative) 125

UK weather forecasts have become much more accurate over the last few decades as the computers that do the forecasting have become more powerful. This new machine will continue that trend.

For many years we have verified our forecasts by comparing forecasts of mean sea-level pressure with subsequent model analyses of mean sea-level pressure. These comparisons are made over an area covering the North Atlantic; most of western Europe, and north-eastern parts of North America. From this long-term comparison an average forecast error can be calculated.

The graph shows how many days into a forecast period this average error is reached compared to a baseline in 1980. This graph shows that a three-day forecast today is more accurate than a one-day forecast in 1980.

http://www.metoffice.gov.uk/media/image/7/2/capIndPlot-600.jpg

Comment Re:how pretty (Score 3, Informative) 209

I'm a working scientist. I have a Mac at home for playing, but work is all Linux. OS X has a very slow filesystem, no working package manager (or rather it has at least four, none of which are much good) and only runs on relatively expensive hardware. Good luck building a compute cluster from imacs. Windows is even worse, of course.

Comment Re:Everyone should just say "interesting" (Score 1) 295

NASA and its climate partners (like GISS, NCDC) have been saying that. I don't know who else is saying that, unless they're quoting those sources.

For a long time I think NASA had the only satellite that could measure ice mass accurately. ESA launched their one a couple of years ago, quite a bit fancier than the NASA one, and it's showing the same thing:

http://www.bbc.co.uk/news/science-environment-27465050

West Antarctica continues to lose ice to the ocean and this loss appears to be accelerating, according to new data from Europe's Cryosat spacecraft. The dedicated polar mission finds the region now to be dumping over 150 cubic km of ice into the sea every year. It equates to a 15% increase in West Antarctica's contribution to global sea level rise.

Comment Re:Everyone should just say "interesting" (Score 3, Informative) 295

Antarctic ice recently set a historic record. And not just sea ice, either. Satellite data has been showing the land volume to be growing too.

Are you sure about that? People usually say the sea ice is increasing in extent, but that the land ice (the bit that might raise sea levels) is shrinking rapidly. For example:

http://climate.nasa.gov/news/242/

Gravity data collected from space using NASA's Grace satellite show that Antarctica has been losing more than a hundred cubic kilometers (24 cubic miles) of ice each year since 2002. The latest data reveals that Antarctica is losing ice at an accelerating rate, too.

/. had a recent story on this too, based on data from the same satellite:

http://news-beta.slashdot.org/story/14/09/30/2351213/antarctic-ice-loss-big-enough-to-cause-measurable-shift-in-earths-gravity

Comment Re:It's the Windows Installer's fault (Score 1) 577

The big problem with the Windows model is that everyone can directly modify the registry and one badly-written installer can really mess it up.

OS X's solution is for programs to simply declare (for example) what associations they'd like (there's a small XML file called info.plist in the app bundle), and then for the file manager to update the associations for them as programs are installed and uninstalled by being dragged around.

Because the list of associations is being managed by one (hopefully) sane program, the chances of some random installer causing havoc are removed.

Comment Just turn off dynamic workspaces (Score 1) 250

I agree the gnome3 dynamic workspaces are annoying, but fortunately there's an option to turn them off. You can turn off the top-left-corner gesture too. I use ctrl-f1 - f8 to switch workspaces, it's nice.

I suppose you could argue that the defaults are not great for experienced users, but most experienced users would expect to have to customise their desktop a bit, I think.

Comment Re:But is the increase meaningful? (Score 2) 427

Here's a terrific animation from NOAA putting the current CO2 levels in the context of the last million years or so. It takes a few minutes to watch, but see it to the end.

http://www.esrl.noaa.gov/gmd/ccgg/trends/history.html

tldr: current CO2 levels are about 40% higher than the maximum levels seen in the last ten ice age cycles.

Slashdot Top Deals

UNIX is hot. It's more than hot. It's steaming. It's quicksilver lightning with a laserbeam kicker. -- Michael Jay Tucker

Working...