Comment Re:The last sentence in the summary... (Score 1) 232
Hi rgb,
I've replied to your anonymous response. I'm replying to you here so that it shows up in your notifications.
My plan is to dismiss the statistics with a wave of my hand. Meh, I say.
I never claimed to have statistically rejected a linear trend. I simply pointed out that the sea level rise appears to be accelerating. That is certainly true. Sea level was flat for thousands of years after deglaciation. It rose slowly in the 19th century. Faster in the 20th century. Faster still in the 21st (so far). On the surface, SLR appears to be accelerating. Reevaluation may be required if future data deviates, but based on the data available it is hard to reject acceleration. This agrees with the physics so even without statistical significance, a cohesive picture begins to emerge.
Regarding sensitivity, it would be nice if we could further constrain the confidence intervals on this. I'm not convinced that we can, but I am hopeful that sensitivity lies somewhere closer to the bottom or "most likely" value. I'm also optimistic about the progress that we are already making in addressing the issue, although I believe that a market driven the solution would be more efficient than feed in tariffs.
Regarding models predicting ENSO and PDO. There is no expectation that they will. Nor can they predict large volcanic eruptions. I think you may have missed the point of the recent paper that "threw out the crap models". The retained model runs were not necessarily more skillful and did not differ in their long term projections. They just happened to start from a similar phase in ENSO, but this was not due to skill. GCM’s cannot currently predict the relative timing of El Niños and La Niñas, which are known to be chaotic .
Every year without statistically significant warming that stretches out the "hiatus" has a small incremental negative effect on the best estimate of TCS
That is true, however we are currently in a negative phase of the PDO. As this reverses and temperature rise accelerates we will see that the opposite is true. Which is why it is hard at this point to narrow the confidence intervals further. I'm not sure that I want to delve too deeply into the fantastic paragraphs near the end of your essay but I do believe that we should base our decisions on our best available science.
I was replying to "Here is a graph...". It states that it LOOKS like SLR is already happening (duh!) and that the rise is accelerating
And so it does. the mean rate of global averaged sea level rise was 1.7 [1.5 to 1.9] mm/yr between 1901 and 2010, 2.0 [1.7 to 2.3] mm/yr between 1971 and 2010, and 3.2 [2.8 to 3.6] mm/yr between 1993 and 2010. http://thebritishgeographer.we... You may think that it is obvious but the person I was responding to was unaware.
As to whether or not the future projections
None of it. See for instance: Meehl et al. 2005, Rahmstorf 2007, Jevrejeva et al. 2009, Grinsted et al. 2010, Horton et al., 2008; Vermeer and Rahmstorf 2009, Rahmstorf et al. 2012, Jevrejeva et al. 2010, Jevrejeva et al. 2012, Marzeion et al. 2012, Radic et al. 2013, Slangen and van de Wal 2011, Giesen and Oerlemans 2013, Machguth et al. 2013, Meier et al. 2007, Pfeffer et al. 2008, Jeverjeva et al. 2012, Bengtsson et al. 2011, Fettweis et al. 2008, Mernild et al. 2010, Rae et al. 2012, Yoshimori and Abe-Ouchi 2012, etc, etc, etc.
Can you cite any studies that find otherwise? (or is your plan to simply dismiss the science with a wave of your hand?)
Apparently, the sun has nothing to do with climate.
Not sure I should engage with the "Science=cult" crowd, but... Of solar output affects surface temperatures, just not enough to counter the warming effect of CO2. Solar output has been dwindling since the 80's while global temperatures have been rising: http://woodfortrees.org/plot/p...
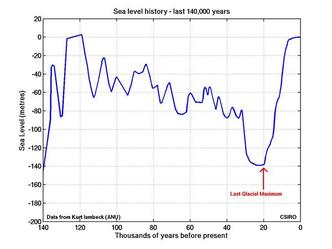
Here is a graph of past, present, and future projections. It looks like sea level is already rising, and that the rise is accelerating. http://thebritishgeographer.we...
If you look into the deep past you find that sea level had been stable for about 10,000 years. Prior to that there was a period of rapid rise during deglaciation: http://thebritishgeographer.we...
when wind blows, if you're running a nuclear or coal plant, you cannot sell any of your produced electricity until your wind/solar competitors sold everything they produced
In a free market wouldn't coal be at a similar disadvantage? Solar/wind would sell for any price above 0 but coal could not sell below the cost of the resource. When the wind is blowing and the sun is shining the renewable utilities will always sell at market price - even if that drives the market price down to almost nothing. We really need to develop a market that can handle this. Probably that will mean dropping feed in tariffs and charging the consumer a market rate rather than subsidizing the consumer. New technologies will be required to help manage this. For instance your car would charge automatically when the rate drops below 5 cents (and possibly sell excess when the the price is quite high). It is going to require a revolution but given the trajectory of the cost of solar - that revolution is coming one way or the other.
Ok. "At the end of 2012, there were 76GW (91GW in 2013) of electricity generating capacity installed in China, more than the total nameplate capacity of China's nuclear power stations,[3] and over the year 115,000 gigawatt-hours of wind electricity had been provided to the grid.[4] In 2011, China's plan was “to have 100 gigawatts (GW) of on-grid wind power generating capacity by the end of 2015 and to generate 190 billion kilowatt hours (kWh) of wind power annually” - http://en.wikipedia.org/wiki/W...
For comparison: "As of the end of 2013 the capacity was 61,108 MW.[1] This capacity is exceeded only by China.[2] Projects totaling 12,000 MW of capacity were under construction at the end of 2013, including 10,900 MW that began construction in the 4th quarter.[1]" - http://en.wikipedia.org/wiki/W...
Not bad on either account. Here is a comparison of USA to China on solar power. The trend is very exciting and probably scares the pants off of traditional utilities: http://www.wolframalpha.com/in...
Here is a comparision of USA to China on wind power. Also an exciting trend: http://www.wolframalpha.com/in...
It looks like China really needs to catch up on nuclear. If they start popping out nuclear plants like they do wind turbines we are in real trouble.
You don't have to admire their government to be concerned that China is leading the way to a new energy economy while a significant portion of the electorate in the west refuses to accept basic physics. We used to be the leaders and innovators. What happened? There is an energy revolution underway and we don't seem to want any part of it.
One wind turbine an hour. Can we compete with that? Shouldn't we at least try?
immediate proximity to a border has very little to do with trade,
How do you figure? Do you think it is a coincidence that 70% of Canadian exports are to the USA? Also, it is worth noting that two of Canada's provinces have revenue neutral carbon taxes. One has closed down all coal plants. They are making strides, but there is a concern that being too far ahead of the curve will put them at a disadvantage.
The PDO cycle dominates over the short term, so if PDO is negative then atmospheric temperatures will be negative. PDO does not have a trend.over the long run so while it has a great effect on the 10 or 20 year trend, it has no effect on the long term trend.
HADCRUT3 has even less coverage than HADCRUT4. Why not use the latest and greatest? Regarding mathematical artifacts, replication over many different reconstructions using different methods and different data gives us confidence in the results. Regarding malfeasance, I'm not sure that the resignation of a journal's editor when it becomes clear that the journal is pushing an agenda at the expense of the truth is malfeasance. I'm not inclined to discuss conspiracy theories although I know these narratives are popular. Suffice it to say that I disagree.
Regarding plotting from 2002, yes the trend line is negative for some data sets. It is more negative if you plot from 2010. What does that tell us? Note that the data is consistently above the trend until about 2007. Note that the data cycles above and below the trend as PDO and ENSO wax and wane. What we are seeing is a steady upward trend with natural variability superimposed on top. We're below the trend line now and the indicators show that we should be. That means we will go back above when the indicators flip back to the positive part of their cycle.
When you look at the data, do you have any expectation that the next El Nino will not be the new hottest year on record? That's even with the PDO strongly negative. You can subtract ENSO and PDO from the trend with this tool and you end up with something closer to the real trend: http://scratch.mit.edu/project...
P.S. if you have kids then you should introduce them to Scratch. I've been showing it to my kids and I've become addicted
An authority is a person who can tell you more about something than you really care to know.
