Comment Except ... (Score 1) 323
According to industry experts
Just like one service can't provide customers with a wide range of top-notch retail products. Except for Amazon.
According to industry experts
Just like one service can't provide customers with a wide range of top-notch retail products. Except for Amazon.
Perhaps public high schools should be held to the same standard. Like Charter Schools.
Your calculation implies that the benefit is full employment. The benefit of science is knowledge. You get an F.
The poster asserts, "Government-funded science is struggling in the United States."
The Federal Government spends more than $130 billion on research and development (R&D) each year, conducted primarily at universities and Federal laboratories.
http://www.whitehouse.gov/blog...
How much should the taxpayers spend on research? Show your work.
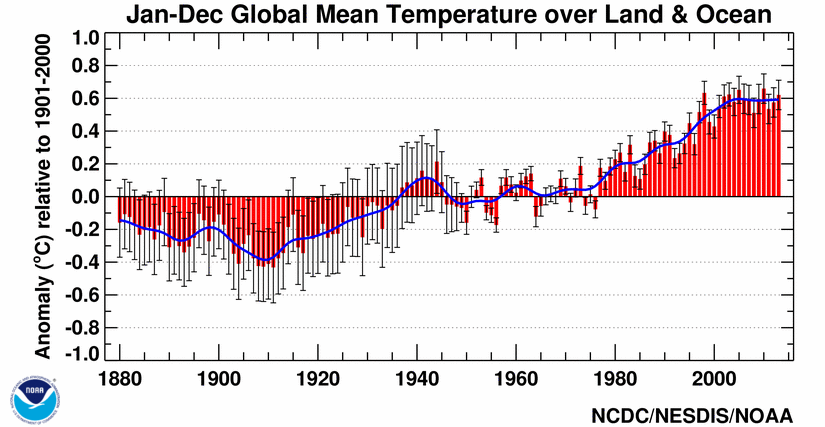
You'll notice in the graph at your link that the temperature trend is flat since about 2000. No warming. Thanks for proving my point.
Big picture here
http://www.ncdc.noaa.gov/sotc/...
I'll respond to you and hope that your friends below manage to find it.
On all data sets below, the different times for a slope that is at least very slightly negative ranges from 8 years and 7 months to 16 years and 8 months.
1. For GISS, the slope is flat since February 2001 or 12 years, 6 months. (goes to July)
2. For Hadcrut3, the slope is flat since April 1997 or 16 years, 4 months. (goes to July)
3. For a combination of GISS, Hadcrut3, UAH and RSS, the slope is flat since December 2000 or 12 years, 8 months. (goes to July)
4. For Hadcrut4, the slope is flat since December 2000 or 12 years, 8 months. (goes to July)
5. For Hadsst2, the slope is flat since March 1997 or 16 years, 4 months. (goes to June) (The July anomaly is out, but it is not on WFT yet.)
6. For UAH, the slope is flat since January 2005 or 8 years, 7 months. (goes to July using version 5.5)
7. For RSS, the slope is flat since December 1996 or 16 years and 8 months. (goes to July)
http://wattsupwiththat.com/201...
There is an embarrassing (for you) graph at the link in case you have trouble with numbers.
I've shown you my data now you can show me yours and we'll see who is the moron, you moron.
It's a failure that highlights the danger of relying on big data technologies.
Or big models. Like climate models. The ones that have predicted a warming climate for the past 15 years while the climate has not warmed.
You know that old joke
How do these bozos plan to power the lives 300+ million Americans who like to read at night, watch TV and have electric appliances do their laundry and wash their dishes.
And don't just say, "solar" or "wind" without including the cost (in $Gazillions) and time (in decades) to build out an entirely new infrastructure while inventing some way to store power for calm nights.
Nuclear? Great. Better start changing regulations and lining up money. Lots and lots of money.
A low bar.
Alfalfa is used to feed dairy cattle that produce
'Ninety-nine percent of people have seen no economic improvement over the last decade,' he said
I'd like to see an authoritative reference for this statement.
Like most stories about electric busses, electric trucks and electric cars, this one includes no useful information about cost. Who thinks that without a taxpayer handout, this thing makes any economic sense to the Kings Canyon Unified School District?
Pure Pork.

And making typewriters and mainframes propelled IBM to success in the 60s.
And once she's running Linux, grandma will stop calling with all those support questions.
"If I do not want others to quote me, I do not speak." -- Phil Wayne
