Want to read Slashdot from your mobile device? Point it at m.slashdot.org and keep reading!


Forgot your password?
typodupeerror
×

Comment Re: Looking more and more likely all the time... (Score 1) 518

Pretty sure the GP wasn't being quite so black & white. All scientific models are an approximation of reality, as you say, and the only real question is are they "good enough to be useful" for your situation. Newton wasn't incorrect, Relativity just better approximates reality at scales outside Newton's experience.

GP's post isn't "very wrong"; it's correct for to a "good enough" approximation of the question: established physics is virtually never disproved, merely improved at wider scales.

Comment Re: Odd sense of hypocrisy (Score 1) 191

Compromise is when you get some of what you wanted, but not all.

Horse trading is when you support something you don't care about in exchange for something you do.

Hypocrisy is when you claim to dislike something, then support it anyway.

I see no reason why politics cannot function with only the first two.

Comment Re: Coral dies all the time (Score 1) 167

I just know

Say no more.

Thanks, it's been fun & all, but I can see this is going nowhere. If you feel peer-review results can be challenged, then you better come up with even more solid data - not your own inexpert "reality check". If you think a consensus of experts is meaningless (or merely "political") without stopping to consider why the majority might be in agreement, then I can't see how me citing more data will help you.

Comment Re: Coral dies all the time (Score 1) 167

As to the corrections... this is common knowledge:

Yes, you gave that link already, and I responded. This conversation is going around in circles.

did you look at the spread sheet I sent you?

Yes, and responded with a link to a graph of it.

while you accuse me of cherry picking that hasn't stopped you from doing it

If you can find datasets that are more complete than the ones I've cited, please do link to them. I gave you all the data I could find, including pH & sea level, and I even found different proxy data for you that went back further. Your turn.

As to Vermeer, I don't know why you're taking about him instead of defending the church graph.

It's the same graph! Same dataset, same values, same time period (1870-2010) = same graph.

If you still think it doesn't show an accelerating trend, draw a straight line on it and see how well that fits.

the graph of increase in CO2 in the atmosphere is linear

No, it isn't. Here is the full Mauna Loa CO2 record. And yes, it's accelerating - look at the graph directly below it, which shows atmospheric CO2 growth rate. See how it's now around double what it was in the 60s?

Your "issues" seem to be based around wondering why the results aren't quite what you think they should be. Perhaps it's all just not as simple as that?

Comment Re: Coral dies all the time (Score 1) 167

By the calculations I did the actual rate of increase in CO2 shows that about 2/3rds of that is absorbed by the biosphere at least because the rate of change in the atmosphere has been less than 1/3rd our emissions.

Humans emit around 26 Gt/year of CO2. Annual atmospheric CO2 increase is currently about 2.1ppm, which works out to about 15 Gt. The difference is being absorbed, primarily by oceans (causing acidification), but clearly it's not enough.

Volcano eruptions are a tiny blip on this process, as I pointed out in the other post.

So this covers 5 years during a solar minimum.... and the imbalance figure is significantly lower than previously thought.

Is it? It's still a significant imbalance - and the overall imbalance figure is of course higher, when the sun is not at a minimum.

An imbalance I would point out does not prove causation

A measurable net influx of energy is precisely what's causing global warming.

What's causing most of this net influx of energy? CO2 has a well-established mechanism, and the calculated effect correlates surprisingly well with our observations. Unless and until someone proposes a new cause that better fits the data, we'd be foolish not to act on what is by far the most likely cause.

whether or not any of this is actually bad is debatable.

It's been studied extensively. The conclusions remain clear - it's bad for our food and water security, it's bad for our health, it's bad for our weather, and it's bad for our coastal communities. There are some upsides (more in the long term), but they are greatly outweighed by the negatives - which will be particularly harsh for the world's poor, who cannot pay the cost of adapting.

The [peer review] process is not infallible.

Nor is it meaningless.

Just because something goes through that process doesn't mean it can't be questioned.

Of course it is questioned - before, during & after peer review - by experts. But when numerous experts have questioned it, and found no cause for doubt, what makes you think a layman is likely to find something they missed?

If you, or me or any layman, thinks we've discovered a mistake in a peer-reviewed paper for any complex scientific field - it's far more likely that it's us that has made the mistake, than the paper's authors AND all the experts who reviewed it, including after publication. Wouldn't you agree?

Dunning-Kruger effect...appeal to authority... You want to call me stupid?

No, not stupid, never said that. Ignorant of the field, yes - just like me. We are both profoundly ignorant of climate science, at least compared to any practicing climatologist. Dunning-Kruger is the assumption that one already knows all one needs to know about a field to make a valid judgement, and says nothing about intelligence. Why do you assume that it's an insult? It's an unconscious bias that we all need to strive to avoid.

I'm deferring to expertise, not appealing to authority. If someone thinks expertise is meaningless, that would be Dunning-Kruger.

Do you want science or politics? I'm not interested in attempts to conflate the two.

Seems to me you're the one conflating scientific consensus with politics.

Comment Re: Coral dies all the time (Score 1) 167

The records were showing a cooling trend until they were recalibrate

Please cite data that shows that.

even the corrected datasheets don't show warming if you look from 1998 to today

What was that you were saying about cherry-picking trends?

In any case, surface temperatures are only one symptom of climate change - and we know they're quite variable over decadal periods. Others, like ocean heat content, ice melt, and sea level rise, are still rising. And that table you cited looks to me like mostly negative anomalies in the 70s, and mostly positive anomalies in the current time - how is that not a warming trend? Perhaps a graph would make it clearer?

The sea rise is linear.

No, it isn't. The difference in trend from the first couple of decades to the last couple looks clearly visible to me, and Vermeer's graph of the derivative rate of change makes the accelerating sea rise crystal clear.

I think a large volcanic erruption might create such a rise...

The Mount Pinatubo eruption emitted 42 million tonnes of CO2. Human emissions in 1991 were 23 billion tonnes of CO2. Don't expect to see much of a blip.

The IPCC figure you're citing is 120 years... that seems obviously impossible

Why do you assume they're wrong, instead of assuming you're missing something?

As I said (and my citations tried to explain), it's not as simple as a fixed number. CO2 uptake depends on numerous processes, some of which are feedback loops. Some CO2 is re-absorbed quickly, some slowly, and some of it takes centuries to be removed from the atmosphere. That's why I mentioned the CO2 lifetime graphs - it's not a linear process.

But you only have to look at the rising atmospheric CO2 levels to see that, clearly, our CO2 emissions are currently exceeding the uptake.

I'm utterly indifferent to how many people agree with you.

It's got nothing to do with how many people agree with me. It's got everything to do with how many experts agree with each other.

you're skipping over my request for a longer trend line on pH values in the ocean.

Did you look at the graph page 4 of the presentation link I gave? Is 25 million years not long enough?

If you can find other data from 1900, please do feel free to cite it.

don't like having to validate your positions

Still waiting for you to validate yours. You've made a lot of claims, but cited very little data - and the data you've cited so far has contradicted your claims, not backed them.

Comment Re: Coral dies all the time (Score 1) 167

I've found nothing to suggest that that band is special in anyway.

It's only "special" because we're pumping gigatonnes of CO2 into the air every year. That makes its effects relevant to us.

Regarding the earth's energy fluxes (in and out), we can measure those accurately with satellites (not just the less-accurate surface measurements you cite further down). See this picture for figures, and details, particularly Fig 2 - the energy imbalance is +0.58±0.15 W/m^2, even during a solar minimum (and you'll note the error levels are perfectly reasonable).

just because you publish something and it gets peer reviewed, it doesn't mean anything in the paper is valid or that the underlying conclusions of the paper are beyond criticism.

It's not an absolute guarantee of truth (there's no such thing) - but it's the closest we've been able to get. Individual papers can be wrong (though far more often they're simply incomplete), but you can't dismiss all peer-reviewed papers because of that, particularly when similar conclusions are reached from independent evidence, all across the field, for decades.

As to whether my own intelligence is enough... you're missing the point. It has to be enough. If it isn't then I have no choice but to simply assume something is valid or disbelieve everything by default.

Or, you could accept that certain other people are better equipped (by means of study, experience and access to data, if not intelligence) to make judgements about the evidence, than yourself, and defer to their conclusions. You can't hope to make an informed conclusion yourself about any field you know so little about, any more than myself or any layman. To assume your own meagre knowledge is sufficient to contradict the findings of experts is pure Dunning-Kruger effect.

As to your question about whether a scientific paper has ever misrepresented itself... this is a very odd statement you're making. You're suggesting that no scientist has ever lied?

I did not say that. I said there's such broad agreement among climatologists and institutions - are they all misrepresenting the truth? Every one of them?

To dismiss consensus as "political" is to accuse every scientist and institution that endorses the consensus opinion, of falsifying their conclusions for political reasons, which would be career suicide. All those scientists are doing their jobs by evaluating the decades of evidence and reaching conclusions - are you really claiming they're all lying to us?

Comment Re: Coral dies all the time (Score 1) 167

the sats are calibrated with ground data... Every year their numbers are adjusted up...

No, they're not. The measurements are going up, not the adjustments. The citations you yourself provided show only tiny adjustments to the trend, every few years, going both up and down - while the measured temperature trend is ever upwards.

The calibration is not re-done from scratch every year. That would be meaningless, as you say. The satellite data obviously must be kept comparable, both to itself and to ground measurements, so that any trends can be determined. Give these people some credit, would you? not to mention the expert reviewers who checked their methods.

I can't cross reference that information with any other source

Similar data is in the HadCRU and NASA datasets, not just NOAA. They're all cross-checked with each other and with related evidence. Perhaps you should look harder.

As to Vermeer, that contradicts what was in the Church paper that you cited yourself.

No, it doesn't. Church's Fig 5 and Vermeer's Fig 3 Lower are the same graph, though Vermeer has a blue trend line drawn over the red measurement line. You can see clearly they have the same values at the same decades. Fig 3 Upper is the derivative of that trend line, showing rate of change.

how long do you think CO2 remains in the atmosphere?

Individual molecules of carbon are being re-absorbed - and re-emitted - all the time, by plants and by the ocean, in large quantities (around 200Gt/year). This is normally in equilibrium, with a slow growth from geologic weathering and occasional volcanism. The rates of natural emission and uptake aren't fixed however, due to numerous feedbacks, so the best we can say is between 30 and 95 years for much of it, with perhaps 20% persisting a lot longer (thousands of years). It depends a lot on the atmospheric concentration, and how much we keep releasing. This page discusses the issue and provides lifetime graphs.

If true this implies the CO2 from our sources is being emitted at a lower rate than the biosphere's absorption ability.

Obviously that's not the case, because atmospheric levels have gone up sharply for 150 years See this ice-core data and more recent Mauna Loa data, showing a definite acceleration even in the last 50 years.
Regarding CO2 spectrum absorption, your questions were already answered by the citations I've given. Broad-spectrum sunlight is not only reflected, but also absorbed and re-radiated in infra-red (look up black-body radiation), which is then partially blocked by various greenhouse gases. This is well-understood science going back to the 1800s. and I'm not going to go over it all yet again. I've already cited papers that quantify the measured radiative forcing of CO2. There's no serious debate about this aspect, only about the feedbacks and resulting temperature rise.

Regarding ocean acidification, Turley et al 2006 is cited by many. Can't find a link to the paper, but here is a related presentation by Turley - see page 4.

Sorry, but I no longer have the time to spend with long explanations. It's taking too much time from my work. If the many peer-reviewed papers I've already provided haven't convinced you of anything, then providing more won't help. Either you're unable to follow the studies I've cited, or you're unwilling to to accept them as valid evidence, despite peer review and cross-correlation with other evidence. You claim that the broad agreement among climatologists and scientific institutions is somehow not expert opinion, but dismiss it as "political" - yet your own decidedly non-expert doubts and admitted political preconceptions are more convincing to you? Sorry, I can't help you further.

Comment Re: Not that hard to create a council. (Score 1) 30

Where the situation gets complicated isn't so much who handles the exploits, it's during the research.

You're a security researcher, you've got a couple of potential holes you're looking into; crash bugs you might be able to leverage into execution then chain them to break through a browser sandbox, say, but they're not yet ready for submission to the vendor. Then you travel overseas to a conference to present some interesting related techniques. You bring your laptop with some of your unpublished recent research on it.

And now you can be locked up for exporting secret weapons-grade exploit technology. Until the exploit is handed over, to the vendor or a council or whoever, any research is classed as a potential forbidden weapon.

Comment Re: Coral dies all the time (Score 1) 167

For polar temperature measurements - don't forget we have satellites too. We're not relying solely on a handful of ground stations, but their measurements help confirm our satellite results.

I can't believe you're still confused about "the zeta joules". Earth has an energy budget, right? A near-constant amount of energy from the sun comes in (about 700 terawatts from memory), and a variable amount goes out. The difference in energy remains on the earth - in the atmosphere, but mostly in the oceans. Energy units are measured in joules, where a joule is one watt for one second. If we're measuring the ocean heat content in "zeta joules", that's clearly a lot of energy that is being stored. I have no idea why you find this so baffling, let alone "several other scientists".

Regarding sea level rise, look at Vermeer 2009 for example, specifically Fig 3.

You can see that not only has the sea level been rising, but the rate of change in the sea level has also been rising - and has more than tripled in recent years, due to faster ice melting.

Comment Re: Coral dies all the time (Score 1) 167

You're saying that that little sliver of spectrum that is unique to CO2 is the only frequency that energy is radiated away from earth on? That's nonsense.

Of course I'm not saying that. Please re-read what I did say. Water vapour blocks much of the outgoing energy, and CO2 blocks some of what's left. Their effect is added.

we are seeing plants respond to the increase in CO2.

Sure, and the ocean has increased its CO2 uptake too (hence the acidification). But it's not nearly enough, hence our CO2 levels are still rising. Plant uptake would have to increase enormously to make a substantial difference, especially as it's a relatively small fraction of the total.

Therefore, radiative heat transfer is not how heat flows through our atmosphere. It isn't possible.

Heat moves through our atmosphere with both radiative and convective transfer (and probably a little conduction too). Heat cannot leave our atmosphere by convective transfer, as we're surrounded by a vacuum. Therefore, radiative transfer is the only way heat can actually leave our planet. That's why it's important.

Your citation is only an abstract, but models both convective transfer of heat to upper atmosphere layers, and radiative transfer as a Planck black-body radiator. It agrees that CO2 has a warming effect, though the amount calculated is much lower than more recent research (the exact figure is still being determined).

Explain why my reading of the spectrum charts is wrong.

It's not so much wrong, as not really the point. Yes, there's a lot of overlap between CO2 and water. But even if atmospheric water blocked 100% of the radiation covered by its absorption spectrum (it doesn't), CO2 would still have an additional effect. And any overlapped frequencies that aren't blocked completely by water, CO2 will also have an additional effect.

The point is, degree of overlap is not the issue. Amount of outgoing energy blocked by CO2 is the issue. And the figure to look for there is radiative forcing, calculated as 3.7 W/m^2 (this article shows how to derive CO2 forcing from first principles, and compares it to satellite measurements). This is the raw effect that increasing CO2 has on our atmosphere (which is then complicated by numerous positive & negative feedback effects).

I just don't see how it could matter.

You haven't done the maths. Your gut feeling is not reliable here. Look at the science, not your preconceptions.

In regards to not listening to the progressives but listening to the scientists... the problem is that the the one will misrepresent themselves as the other.

What evidence do you have that any scientific papers have misrepresented anything?

I can't just trust anyone. The only defense I have is to use what intelligence I have and go through the argument and logically evaluate it brick by brick.

Unfortunately, without years of study and experience, that's simply not enough.

Your choices are: a) get enough experience in the field to be considered an expert, run your own evaluation on the massive amounts of data acquired in the last 30 years, then make an expert judgement of your own, or; b) listen to the many experts who have done exactly that.

Unfortunately, too many people choose c) none of the above, and make snap judgements on limited understanding of the field, and even more limited evidence. This is all but guaranteed to run afoul of preconceptions, political and otherwise. The Dunning-Kruger effect prevents most of these people from even realising how far off base they usually are.

Given your difficulty in even dealing with ocean heat content, you clearly can't choose a) yet, and you certainly shouldn't be choosing c)! (For reference, the specific heat capacity of water is 4.186 joules/gram C, so to calculate the temperature rise in C of [the top 2km of] the world's oceans, divide the energy input in joules by 4.186, and divide by the mass of the water. And try not to get the mass/volume conversion wrong this time ;-)

Unfortunately, it appears to me that you're under the impression that the basic science is still being hotly debated. It really isn't. The specific figures are, yes, but there has long been broad agreement among most climatologists about what's basically happening, and while the dissenting voices of the minority have so far entirely failed to convince their climatologist peers, they've managed to convince a surprising amount of the media and public, many of whom already had strong political (or financial) reasons for not wanting to accept the majority expert findings, and what that might imply.

If you still can't accept the scientific consensus, and you think the half-dozen surveys and studies that confirm this are basically incompetent and/or lying (despite passing peer review), even if you also dismiss all the IPCC surveyed papers as entirely manufactured (and therefore assume that all climatologists involved must be risking career ruin by deliberately misrepresenting the data) - how do you explain that almost all scientific institutions around the world also endorse the finding of AGW - and not even one dissents?

Comment Re: Coral dies all the time (Score 1) 167

comparing at equal pressures gives more of an apples to apples comparison. Since you can clearly see how radically the temperatures fluctuate based on pressure.

Um, well yeah. The temperatures on different planets are very different, even at the same pressure - as you'd expect, given all the other differences, like distance from the Sun, cloud cover, chemical composition and who knows what else. I'm really not sure where you're going with all this. It certainly doesn't show that "the chemistry of the atmosphere makes almost no difference." It just shows that there are a lot of factors that determine temperature. The pressure may be "apples to apples" but nothing else is.

And of course the temperature goes up & down with the pressure at different altitudes; that's the Pressure-Temperature law I linked to earlier. Perhaps I'm missing something, but I don't see what any of this has to do with the Greenhouse Gas effect.

As to trapping heat... CO2 is hardly unique in this feature nor do I see why it plays a special role in the Earth atmosphere.

What's different about CO2 compared to the other, stronger greenhouse gases like water vapour and methane is that it accumulates over a long time.

Water vapour is a stable quantity in the atmosphere (for a given temperature). Any excess simply precipitates out as rain. It doesn't increase, at least not until you start warming the air up.

Methane does accumulate, for a while - but it is broken down by UV light over a period of years, so it has only a short term effect as well. It can still be a problem (e.g. if melting permafrost like the Siberian Traps releases significant methane into the atmosphere, which is a real concern and could trigger other warming feedbacks), but it doesn't build up over a long time, so any direct effects of a methane pulse are short-lived.

CO2 takes centuries to be removed from the atmosphere. This is done by vegetation, to a small extent, but the vast majority of CO2 uptake is done by the ocean. Even so, this is a slow process. CO2 has been building up rapidly in our atmosphere, and even if we stopped emitting ALL anthropogenic CO2 tomorrow, it would still take centuries to return to pre-industrial levels. Worse, much of that CO2 being absorbed by the oceans is being converted to carbonic acid, which is resulting in ocean acidification - a decreasing pH that we've been observing for some time, and is already having measurable results on sensitive ocean ecosystems.

I had a hard time finding a graph for CO2 ironically... maybe you can help me out there.

I did find this which should serve: https://commons.wikimedia.org/...

Yep, that looks like a useful graph. It's certainly clear that water vapour has a bigger effect - but the primary point here is that CO2 also blocks outgoing energy. It's in addition to the effect of water vapour. Water doesn't "black out" the effect of CO2, it adds to it, trapping more energy.

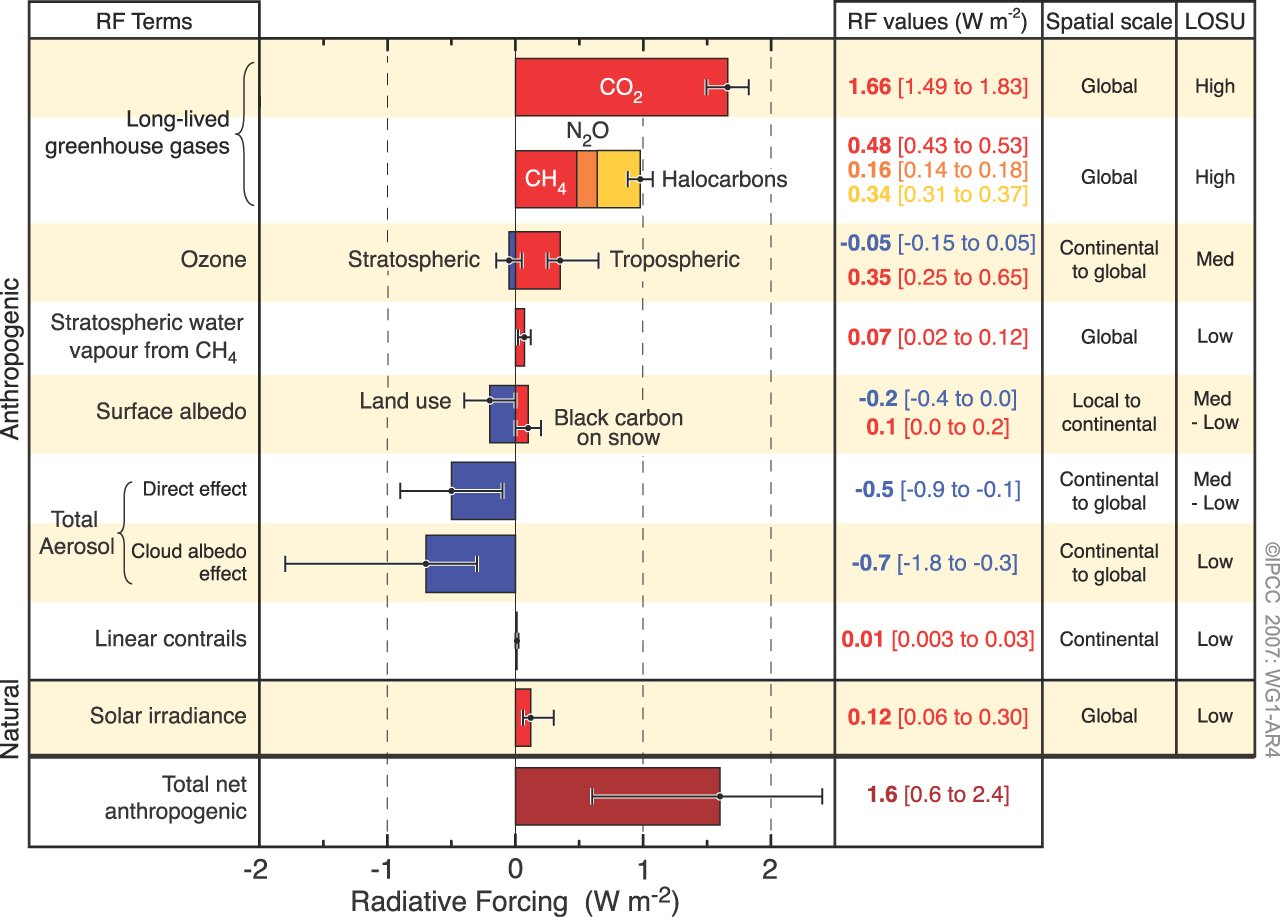
While the water vapour effect is bigger, the CO2 effect is added to this - and that is steadily increasing, as the CO2 in our atmosphere increases. This is enough extra trapped energy to change the temperature equilibrium of our planet; we've done the maths. See e.g. Myhre '98 for how this is forcing value is derived, while Puckrin '04 compares our radiative flux models for a variety of greenhouse gas mixes with atmospheric observations, and finds them to agree well.

Have a look here for a comparison of the radiative forcing values of the significant greenhouse gases, particularly the Greenhouse Gases section and this graph; you'll note that CO2 has the dominant effect. Note also that water vapour isn't considered a forcing (cause of change) - while it traps more energy than CO2, that effect isn't increasing or decreasing - it's stable, because the amount of water vapour in the atmosphere is stable, and therefore is not a direct factor in the increase in temperatures we've been seeing.

However, if something else (like CO2) starts warming the planet, the warmer atmosphere will then hold a little more water vapour, which will increase its effect - in which case it will make the pre-existing warming effect stronger, as a feedback rather than a forcing.

Your entire premise is based on the notion that a trace gas with almost no unique spectrum is going to trigger all sorts of dramatic changes in our climate.

It's not just "my" premise; it's accepted by the vast majority of climatologists and atmospheric scientists. The specific percentage of CO2 is not the issue; the effect of it is, and the changes in that percentage & effect.

And I just don't see any evidence of that. The historical record doesn't appear to back it up. We see CO2 concentrations coming AFTER warming in the historical record.

Sure, because there can be other causes of warming besides CO2, such as orbital cycles. And this warming can trigger the release of CO2, e.g. warming oceans hold less dissolved CO2. So when something else warms the planet, CO2 release follows soon after - and then amplifies the warming through the greenhouse effect. 90% of the warming follows after the CO2 release. But none of this prevents CO2 from causing warming, if we release it into the atmosphere ourselves.

We also see periods of time with high CO2 and low temperatures.

There have been such times in the distant past, yes - but solar output was significantly lower then. CO2 isn't the only driver of climate - solar output is of course a major factor, as are orbital variations. The last time CO2 was around 400 ppm was about 3M years ago, for a few thousand years - and temperatures then were about 2-3 degrees higher than now.

I'll be honest, what got me hot and bothered on the issue was the politics... You had Al Gore standing up there talking... I don't trust the man. I also saw a lot of progressive political elements jumping on board and the whole solution to AGW seems very convenient for them.

So don't listen to Al Gore. He's another example of that bad reporting I was talking about. Ignore the "progressive political elements" too. But don't let political biases blind you to what the science is saying!

Don't listen to Al Gore or Anthony Watts or even me - listen only to the papers that are cited. The deniers insist the alarmists are making it all up... who cares, only the science is important. If you read the cited papers themselves you'll find a refreshing lack of politics, unlike all the noise around the subject. Once a clear picture of what's actually happening is obtained, then we can worry about what to do about it (which is certainly political).

As for shutting people out of the discussion, that obviously hasn't happened - there's more noise on both sides than ever. But within the scientific circles, there's only one criteria for whether you get a voice - you have to have data to back your conclusion, obtained by solid methodology that passes review by your expert peers. If you don't have solid data, you don't get to publish doubtful conclusions. You'll have to agree that's for the best.

Anyway, this discussion's been fun & all, but I've spent way too much time writing all this out and finding appropriate citations. Please do read at least the abstracts and conclusions. If you don't find those convincing, then nothing else I say will help. Best of luck with it all.

Slashdot Top Deals

"And remember: Evil will always prevail, because Good is dumb." -- Spaceballs

Working...